PROBLEMA EXPERIMENTAL. Estudio de la vibración transversal de una regla metálica.
Fundamento teórico.
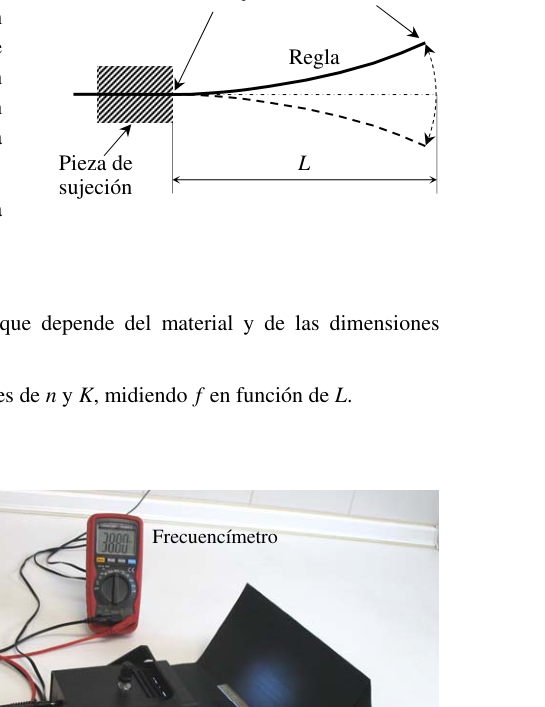
En este experimento se van a estudiar las oscilaciones transversales de una regla metálica en función de su longitud libre, . En particular se estudiará el modo fundamental de vibración, con un nodo en el extremo fijo y un único antinodo (vientre) en el extremo libre, como se esquematiza en la figura adjunta.
Se espera que la frecuencia de vibración de la regla, , dependa de su longitud en la forma
donde es un número entero y es una constante que depende del material y de las dimensiones transversales de la regla.
El objetivo de esta prueba es determinar los valores de y , midiendo en función de .
Procedimiento experimental
Una pieza metálica permite sujetar la regla con una longitud libre ajustable, . El conjunto se sujeta a la mesa con un “sargento”. La oscilación de la regla es demasiado rápida para poder cronometrar manualmente su periodo. Para medir la frecuencia de oscilación se recurre a un sistema de iluminación estroboscópica: una fuente de luz emite pulsos luminosos periódicos muy breves, con una frecuencia, , que se puede modificar. Cuando la frecuencia del estroboscopio coincida con la frecuencia de oscilación de la regla, es decir , los sucesivos pulsos iluminarán la regla pasando por la misma posición, de forma que la regla se verá aparentemente en reposo.
Para una serie de longitudes de la regla, se ajusta la frecuencia del estroboscopio hasta conseguir que la regla vibrante se vea aparentemente quieta, y esta frecuencia de iluminación se mide con un frecuencímetro. En la siguiente tabla se presentan los resultados obtenidos, suponiendo :
| (m) | 0,100 | 0,110 | 0,120 | 0,130 | 0,140 | 0,150 | 0,160 | 0,170 | 0,180 | 0,190 | 0,200 | 0,210 | 0,220 |
|---|---|---|---|---|---|---|---|---|---|---|---|---|---|
| (Hz) | 41,03 | 35,31 | 29,48 | 24,27 | 21,32 | 9,51 | 16,05 | 14,72 | 12,94 | 11,85 | 10,43 | 9,31 | 8,60 |
Cuestiones.
a) El valor de presentado en la tabla para m es claramente erróneo, pues se aleja de la tónica que siguen las demás medidas. Piensa y explica cuál puede ser la causa del error, y corrige adecuadamente ese valor de . Si no encuentras una solución lógica al problema, desecha la medida y sigue adelante.
b) A partir de las medidas indicadas en la tabla, con la gráfica y el ajuste que consideres oportunos, deduce el valor del exponente en la ecuación (1). Recuerda que debe ser un número entero.
Ayuda: tomando logaritmos en (1) obtendrás una relación lineal entre los logaritmos de y de .
c) Determina el valor de la constante de la regla.
d) Haz una estimación de la incertidumbre (margen de error) de esta constante, .
 Metal rule clamped at one end, stroboscope setup
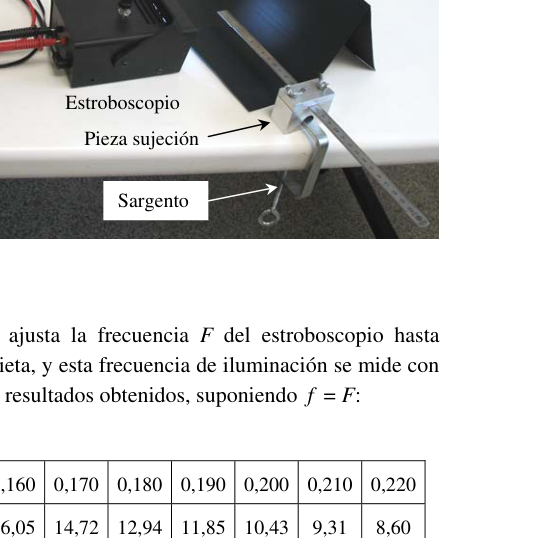 Photo of experimental setup with clamp
Topic: Oscillations & Waves, Elasticity & Materials Metodi: Graph Linearization, Experimental Data Analysis, Simple Harmonic Motion Analysis Competenze: Graph Linearization, Experimental Data Analysis Objects: Rod, Beam Fonte: Testo (PDF) — p.2
Il problema è quello di sperimentare. Studi di vibrazione trasversale di una regola metallica.**
Fondo teorico.
In questo esperimento si studiano le oscillazioni trasversali di una regola metallica in base alla sua lunghezza libera, . In particolare, si studierà il modo fondamentale di vibrazione, con un nodo all’estremità fissa e un singolo antinodo (ventri) all’estremità libera, come illustrato nella figura allegata.
La frequenza di vibrazione della regola, , è prevista a seconda della sua lunghezza nella forma
dove è un numero intero e è una costante che dipende dal materiale e dalle dimensioni trasversali della regola.
L’obiettivo di questa prova è determinare i valori di e , misurando in funzione di .
Processo sperimentale
Un pezzo metallico consente di fissare la regola con una lunghezza libera regolabile, . Il set si attacca al tavolo con un “sergente”. L’oscillazione della regola è troppo veloce per poter cronometrare manualmente il suo periodo. Per misurare la frequenza di oscillazione si ricorre a un sistema di illuminazione strofoscopica: una fonte di luce emette pulsi luminosi periodici molto brevi, con una frequenza, , che può essere modificata. Quando la frequenza dello strofoscopio coincide con la frequenza di oscillazione della regola, cioè , i successivi impulsi illumineranno la regola passando attraverso la stessa posizione, in modo che la regola apparentemente si vedrà a riposo.
Per una serie di lunghezze della regola, si regola la frequenza dello stroboscopio fino a far apparire la regola vibrante apparentemente ferma, e questa frequenza di illuminazione viene misurata con un frequentometro. La tabella seguente presenta i risultati ottenuti, supponendo :
| (m) | 0,100 | 0,110 | 0,120 | 0,130 | 0,140 | 0,150 | 0,160 | 0,170 | 0,180 | 0,190 | 0,200 | 0,210 | 0,220 |
|---|---|---|---|---|---|---|---|---|---|---|---|---|---|
| (Hz) | 41,03 | 35,31 | 29,48 | 24,27 | 21,32 | 9,51 | 16,05 | 14,72 | 12,94 | 11,85 | 10,43 | 9,31 | 8,60 |
Questioni.
a) Il valore di riportato nella tabella per m è chiaramente errato, in quanto si allontana dalla tonalità seguita dalle altre misure. Pensate e spiegate quale possa essere la causa dell’errore, e correggiate correttamente quel valore di . Se non trovi una soluzione logica al problema, scarica la misura e continua.
b) Sulla base delle misure indicate nella tabella, con il grafico e l’aggiustamento che ritieni opportuno, deduci il valore dell’esponente nell’equazione (1). Ricorda che deve essere un numero intero.
Aiuto: prendendo logaritmi in (1) otterrete un rapporto lineare tra i logaritmi di e di .
c) Determina il valore della costante della regola.
d) Estimare l’incertezza (margine di errore) di questa costante, .
Metal rule clamped at one end, stroboscope setup
Foto di setup sperimentale con clamp
Topic: Oscillations & Waves, Elasticity & Materials Metodi: Graph Linearization, Experimental Data Analysis, Simple Harmonic Motion Analysis Competenze: Graph Linearization, Experimental Data Analysis Objects: Rod, Beam Fonte: Testo (PDF) — p.2
The first is the “Study” test. Study of the transverse vibration of a metallic rule.
The following is the list of the main types of insurance companies:
In this experiment, the transverse oscillations of a metallic rule based on its free length, , are studied. In particular, the fundamental mode of vibration will be studied, with a single node at the fixed end and a single antinode (belly) at the free end, as outlined in the figure attached.
The vibration frequency of the rule, , is expected to depend on its length in the form
where is an integer and is a constant that depends on the material and cross-dimensions of the rule.
The purpose of this test is to determine the values of and by measuring in relation to .
The following information is provided by the Commission:
A metal part allows the rule to be held with an adjustable free length, . The set is attached to the table with a “sergeant”. The swinging of the rule is too fast to be able to manually timetable its period. The measurement of the oscillation frequency is based on a strobe lighting system: a light source emits very short periodic light pulses, with a frequency , which can be modified. When the stroboscope frequency matches the rule oscillation frequency, i.e. , successive pulses will illuminate the rule by passing through the same position, so that the rule will appear apparently at rest.
For a series of lengths of the rule, the frequency of the stroboscope is adjusted to make the vibrating rule appear apparently still, and this lighting frequency is measured with a frequency meter. The following table shows the results obtained, assuming :
| (m) | 0,100 | 0,110 | 0,120 | 0,130 | 0,140 | 0,150 | 0,160 | 0,170 | 0,180 | 0,190 | 0,200 | 0,210 | 0,220 |
|---|---|---|---|---|---|---|---|---|---|---|---|---|---|
| (Hz) | 41,03 | 35,31 | 29,48 | 24,27 | 21,32 | 9,51 | 16,05 | 14,72 | 12,94 | 11,85 | 10,43 | 9,31 | 8,60 |
The Commission has also adopted a number of proposals for the implementation of the programme.
(a) The value presented in the table for m is clearly incorrect, as it deviates from the tonic followed by the other measurements. Think and explain what the cause of the error may be, and correct that value of appropriately. If you can’t find a logical solution to the problem, discard the measure and move on.
(b) From the measures shown in the table, with the graph and the adjustment you deem appropriate, deduct the value of the exponent in equation (1). Remember that must be an integer.
Help: taking logarithms in (1) you get a linear relationship between the logarithms of and .
(c) Determine the value of the rule constant .
(d) Estimate the uncertainty (error margin) of this constant, .
Metal rule clamped at one end, stroboscope setup
Photo of experimental setup with clamp
Topic: Oscillations & Waves, Elasticity & Materials Metodi: Graph Linearization, Experimental Data Analysis, Simple Harmonic Motion Analysis Competenze: Graph Linearization, Experimental Data Analysis Objects: Rod, Beam Fonte: Testo (PDF) — p.2