Prueba experimental: Absorción de luz por un filtro neutro
Objetivo
En ocasiones interesa reducir la intensidad de un haz de luz, para lo que puede emplearse un filtro comercial de gelatina. Cuando un haz de luz de intensidad incide sobre una de las caras planas del filtro, parte de la luz se transmite y emerge por la otra cara con una intensidad inferior .
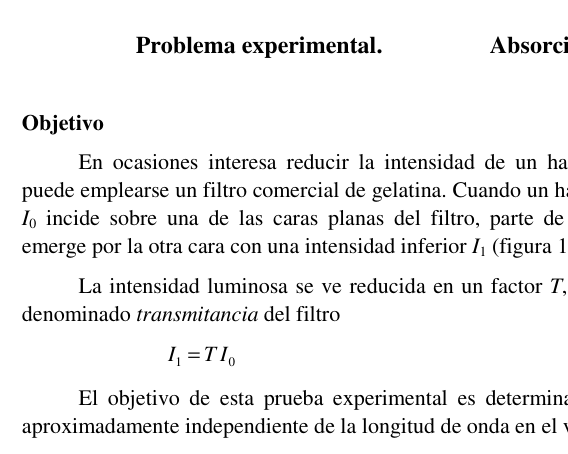
La intensidad luminosa se ve reducida en un factor , menor que la unidad, denominado transmitancia del filtro:
El objetivo de esta prueba experimental es determinar la transmitancia de un filtro neutro (con aproximadamente independiente de la longitud de onda en el visible) por dos procedimientos diferentes.
Modelo teórico
Teniendo en cuenta (1), cuando el haz de luz atraviesa un conjunto de filtros iguales, la intensidad transmitida final es:
Esta intensidad transmitida se mide con un fotodetector. Supondremos que la diferencia de potencial entre sus terminales de salida es directamente proporcional a dicha intensidad. En consecuencia, la expresión (2) se transforma en:
donde es la lectura del voltímetro cuando se interponen filtros.
Procedimiento experimental
El sistema consta de dos circuitos: el primero está formado por una pila, una resistencia y un led que actúa como emisor de luz, y el segundo lo constituye otro led, que actúa como fotodetector, conectado a un polímetro en función de voltímetro. Los dos circuitos se acoplan ópticamente mediante un tubo para mantener fija la distancia entre emisor y detector y apantallar la luz ambiente. El tubo tiene una ranura transversal en la que se colocan los filtros.
Primer procedimiento para determinar
Sin ningún filtro en la ranura del tubo () se anota el valor indicado por el voltímetro, . Se coloca un filtro en la ranura () y se toma la medida , etc. hasta acumular ocho filtros. Los resultados son:
| 0 | 1 | 2 | 3 | 4 | 5 | 6 | 7 | 8 | |
|---|---|---|---|---|---|---|---|---|---|
| (mV) | 277 | 192 | 131 | 89 | 60 | 40 | 26 | 17 | 11 |
a) Transforma la expresión (3) para obtener una dependencia lineal entre una función de y . (Ayuda: toma logaritmos en (3).)
b) Representa gráficamente en papel milimetrado los puntos correspondientes a esta dependencia lineal, con en abscisas.
c) Determina la pendiente de la recta que mejor se ajuste a esos puntos.
d) A partir del resultado anterior, deduce el valor de la transmitancia de un filtro, .
e) Haz una estimación de la incertidumbre de .
Segundo procedimiento para determinar
La transmitancia de un filtro también puede determinarse a partir de dos medidas consecutivas con y filtros. Teniendo en cuenta (3), es evidente que:
f) Aplicando (4) a parejas consecutivas de las nueve medidas , calcula los ocho valores correspondientes de .
g) Mediante un tratamiento estadístico, calcula el valor más fiable de la transmitancia de un filtro, y su margen de incertidumbre.
 Light beam through gelatine filter: I0 to I1
 Circuit: LED emitter, LED detector, voltmeter
 Optical coupling tube with filter slot
Topic: Geometric Optics, Circuits Metodi: Experimental Data Analysis, Graph Linearization, Statistical Averaging, Error Propagation Competenze: Experimental Data Analysis, Graph Linearization Objects: Battery, Resistor, Tube Fonte: Testo (PDF) — p.1
Prova sperimentale: Assorbimento della luce da un filtro neutro
Obiettivo
A volte è interessante ridurre l’intensità di un fascio di luce, per cui si può utilizzare un filtro commerciale di gelatina. Quando un fascio di luce di intensità incide su una delle facce piatte del filtro, parte della luce viene trasmessa e viene emessa dall’altra faccia con una intensità inferiore .
L’intensità luminosa è ridotta di un fattore inferiore all’unità, denominato ** trasmissione ** del filtro:
L’obiettivo di questo test sperimentale è determinare la trasmissione di un filtro neutro (con approssimativamente indipendente dalla lunghezza d’onda in visibile) da due diverse procedure.
Modello teorico
Considerando (1), quando il fascio di luce passa attraverso un insieme di filtri uguali, l’intensità trasmessa finale è:
Questa intensità trasmessa viene misurata con un fotodettore. Supponiamo che la differenza di potenziale tra i loro terminali di uscita sia direttamente proporzionale a tale intensità. In seguito, l’espressione (2) si trasforma in:
dove è la lettura del voltometro quando vengono inseriti filtri.
Processo sperimentale
Il sistema è costituito da due circuiti: il primo è costituito da una pila, una resistenza e un led che agisce come emettitore di luce, e il secondo lo costituisce un altro led, che agisce come fotodettore, collegato a un polímetro in funzione di voltometro. I due circuiti sono accoppiati otticamente mediante un tubo per mantenere fissa la distanza tra emittente e rilevatore e per visualizzare la luce ambientale. Il tubo ha un foro trasversale in cui vengono inseriti i filtri.
Prima procedura per determinare
Senza filtri nel tubo () viene annotato il valore indicato dal voltometro, . Si inserisce un filtro nella ranura () e si misura , ecc. fino a accumulare otto filtri. I risultati sono:
| 0 | 1 | 2 | 3 | 4 | 5 | 6 | 7 | 8 | |
|---|---|---|---|---|---|---|---|---|---|
| (mV) | 277 | 192 | 131 | 89 | 60 | 40 | 26 | 17 | 11 |
a) Trasforma l’espressione (3) per ottenere una dipendenza lineare tra una funzione di e . (Aiuto: prendere logaritmi in (3).)
b) Rappresenta graficamente in carta millimetrica i punti corrispondenti a questa dipendenza lineare, con in abcissi.
c) Determina la pendice della retta che meglio si adatta a tali punti.
d) Dalla risultato precedente, deduce il valore di trasmissione di un filtro, .
e) Estimare l’incertezza di .
Seconda procedura per determinare
La trasmissione di un filtro può anche essere determinata da due misure consecutive con filtri e . Considerando (3), è evidente che:
f) Applicando (4) a coppie consecutive delle nove misure , si calcolano gli otto valori corrispondenti di .
g) Calcola con un trattamento statistico il valore più affidabile della trasmissione di un filtro e il suo margine di incertezza.
Light beam through gelatine filter: I0 to I1
Circuito: emittente LED, rilevatore LED, voltmeter
Optical coupling tube with filter slot
Topic: Geometric Optics, Circuits Metodi: Experimental Data Analysis, Graph Linearization, Statistical Averaging, Error Propagation Competenze: Experimental Data Analysis, Graph Linearization Objects: Battery, Resistor, Tube Fonte: Testo (PDF) — p.1
Experimental test: Light absorption by a neutral filter
Objetivo
It is sometimes useful to reduce the intensity of a beam of light, for which a commercial gelatin filter may be used. When a beam of light of intensity hits one of the flat faces of the filter, some of the light is transmitted and emerges from the other face with a lower intensity .
La intensidad luminosa se ve reducida en un factor , menor que la unidad, denominado transmitancia del filtro:
The objective of this experimental test is to determine the transmittance of a neutral filter (with approximately independent of the wavelength in the visible medium) by two different procedures.
Modelo teórico
Whereas (1) when the beam of light passes through a set of identical filters, the final transmitted intensity is:
This transmitted intensity is measured with a photodetector. Assume that the potential difference between their output terminals is directly proportional to that intensity. The expression (2) is therefore transformed into:
where is the read of the voltmeter when filters are intercepted.
Procedimiento experimental
The system consists of two circuits: the first is made up of a battery, a resistor and an LED that acts as a light emitting device, and the second is another LED, which acts as a photodetector, connected to a polymer in terms of voltmeter. The two circuits are optically coupled by a tube to maintain the distance between the emitter and detector and to screen the ambient light. The tube has a transverse groove into which the filters are placed.
Primer procedimiento para determinar
Without any filter in the tube groove () the value indicated by the voltmeter, is noted. A filter is placed in the slot () and the measurement is taken, etc. I’m going to build up eight filters. The results are:
| 0 | 1 | 2 | 3 | 4 | 5 | 6 | 7 | 8 | |
|---|---|---|---|---|---|---|---|---|---|
| (mV) | 277 | 192 | 131 | 89 | 60 | 40 | 26 | 17 | 11 |
(a) Transform the expression (3) to obtain a linear dependence between a function of and . (Help: take logarithms in (3).)
(b) Graphically depicts on millimeter paper the points corresponding to this linear dependence, with in abscises.
(c) Determine the slope of the straight line that best fits those points.
(d) From the previous result, deduct the transmittance value of a filter, .
(e) Estimate the uncertainty of .
Segundo procedimiento para determinar
The transmittance of a filter can also be determined from two consecutive measurements with and filters. In view of (3), it is clear that:
(f) Applying (4) to consecutive pairs of the nine measures , calculate the corresponding eight values of .
(g) By statistical treatment, calculate the most reliable value of the transmittance of a filter and its margin of uncertainty.
Light beam through gelatine filter: I0 to I1
Circuit: LED emitter, LED detector, voltmeter
Optical coupling tube with filter slot
Topic: Geometric Optics, Circuits Metodi: Experimental Data Analysis, Graph Linearization, Statistical Averaging, Error Propagation Competenze: Experimental Data Analysis, Graph Linearization Objects: Battery, Resistor, Tube Fonte: Testo (PDF) — p.1