- PHASES OF WATER (6 points) — Johan Runeson. In this problem we will look at the phase diagram of water (see graphs on a separate page). The first figure shows the phase diagram in a region close to the triple point [(s) – solid, (l) – liquid, (g) – gas], while the second figure shows the melting curve. When two phases and are in equilibrium, the phase transition curve follows the law of Clausius–Clapeyron:
where is the specific enthalpy (enthalpy per mass) of phase , and is the specific volume (volume per mass). i) (1.5 points) Using that , find an expression for the liquid-gas transition curve in terms of the latent heat of evaporation , the pressure at any reference point along the curve, the gas constant and the molar mass . ii) (1.5 points) Approximate the Earth as a system of a homogeneous atmosphere, consisting of air and water vapor, in equilibrium with a sea of liquid water. If the atmospheric temperature rises by , by what percentage does the water vapor pressure rise? (The current temperature of the Earth is .) You may need the values and . iii) (3 points) Use reasonable approximations and calculate , the difference in specific volume between liquid water and ice, at atmospheric pressure.
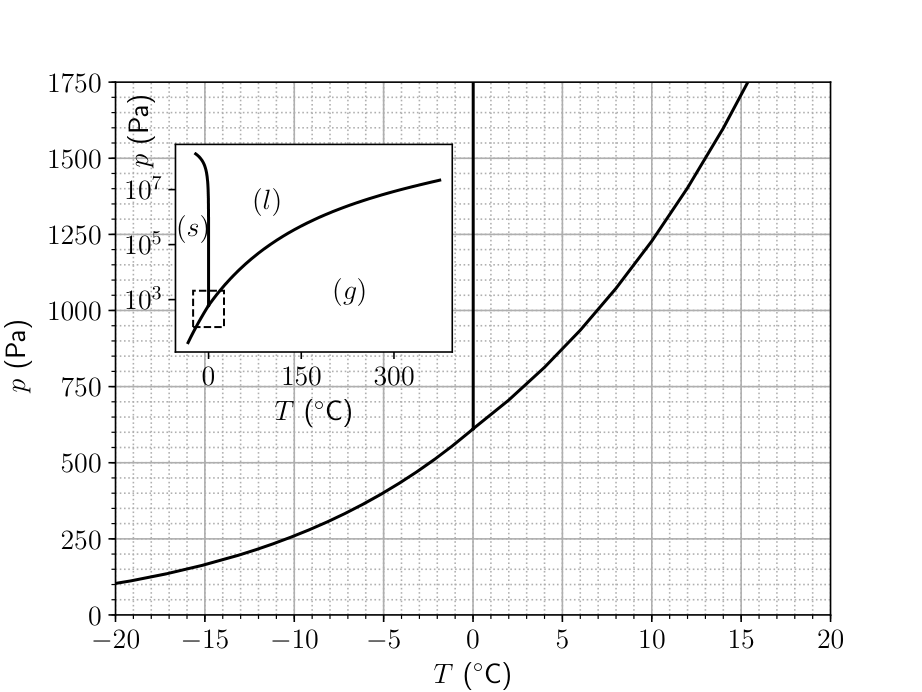 Diagramma di fase dell’acqua (vicino triplo punto)
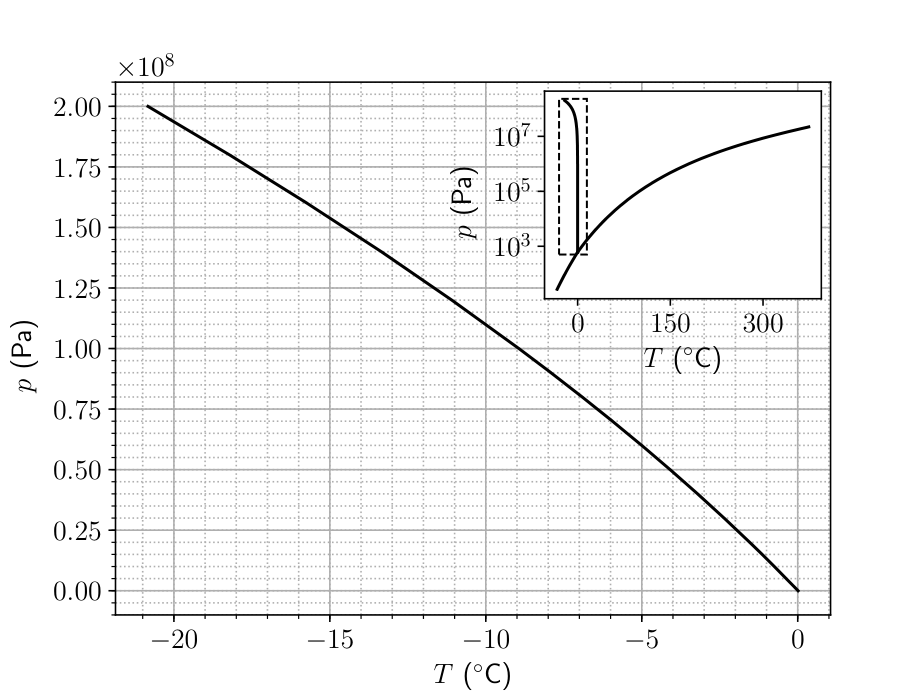 Curva di fusione del ghiaccio p-T
Topic: Thermodynamics Metodi: Ideal Gas Law, Differential Equations, Approximation & Series Expansion Competenze: Mathematical Modeling, Physical Reasoning Objects: Gas Fonte: Testo (PDF) — p.1
- FASE DELLA ACCA (6 punti) Johan
- Runeson. In questo problema si esaminerà il diagramma di fase dell’acqua (vedi grafici di una pagina separata). La prima figura mostra la diagramma di fase in una regione vicina al triplo punto [(s) solido, (l) liquido, (g) gas], mentre la seconda figura mostra la curva di fusione. Quando due fasi e sono in equilibrio, la curva di transizione di fase segue la legge di ClausiusClapeyron:
in cui è l’entalpia specifica (entalpia) per massa) di fase e è la specifica volume (volume per massa). I) (1,5 punti) Usando il , si trova un espressione per la curva di transizione gas-liquido in termini di calore latente di evaporazione , la pressione a qualsiasi punto punto di riferimento lungo la curva, costante del gas e massa molare . (ii) (1,5 punti) Approximare la Terra come sistema di atmosfera omogenea, costituito da aria e vapore acqueo, in equilibrio con un mare di acqua liquida. Se la temperatura atmosferica aumenta di , di quale percentuale della pressione del vapore d’acqua
- Si alza? (La temperatura attuale della Terra) is .) Potrebbe essere necessario utilizzare i valori e . iii) (3 punti) Utilizzare approssimazioni ragionevoli e calcolare , la differenza di volume specifico tra acqua liquida e ghiaccio, a pressione atmosferica.
*Diagramma di fase dell’acqua (vicino triplo punto) *
*Curva di fusione del ghiaccio p-T *
Topic: Thermodynamics Metodi: Ideal Gas Law, Differential Equations, Approximation & Series Expansion Competenze: Mathematical Modeling, Physical Reasoning Objects: Gas Fonte: Testo (PDF) — p.1
- TUNNEL DIODE (10 points) — Jaan Kalda. The V-I-curve of a tunnel diode is depicted in the figure below, curve (a). In some parts of the problem, we use an idealized model curve (b). I (mA) 5 10 15 20 25 400 300 200 100 V (mV) (b) (a) i) (1 point) In order to measure the V-I curve of the diode, it is connected in series with a variable power supply (the value of the electromotive force can be changed from to ), see circuit (a). The ammeter has internal resistance ; the applied voltage is . What is the diode voltage and current ? Use the real V-I-curve of the diode. L A K (b) A (a) A (c) C (d) C r Rd L L ii) (1 point) Now, let us study the effect of the self-inductance of the wires. In order to take into account such an inductance, the circuit needs to be modified as shown in circuit (b); let . The switch K is kept open until the voltage is adjusted to , and is then closed. How long will it take for the current to reach ? Neglect henceforth (until otherwise instructed) the internal resistances of the battery and of the ammeter (put ), and use the idealized V- I-curve of the diode. iii) (1 point) With the same settings as for task ii), how long will it take from the moment when the switch was closed until the diode voltage reaches ? iv) (2 points) With the same setting as for task ii), plot the diode current as a function of time and find the period and amplitude of the current oscillations. v) (2 points) Circuit (b) is used to measure the V-I curve of the diode: for each data point, the voltage is adjusted to the desired value while the switch is kept open, and then the switch is closed. Note that when the ammeter current oscillates with a high frequency, it shows the average current. Plot the expected measurement results, i.e. the average current through the ammeter as a function of the applied voltage . vi) (1 point) Thus far we have assumed that the diode is an ideal device; in reality, it has a small parasitic capacitance, let it be . Taking this into account, our circuit should be drawn as shown in diagram (c). Now we assume the ammeter, again, to be non-ideal, with internal resistance . Let us assume that after closing the switch, the voltage was slowly increased from to so that a stationary (oscillations-free) operation regime and has been achieved. Suppose there is a small perturbation to the diode current and voltage: and , where and are the current and voltage in the stationary operational regime. For small perturbation amplitudes, the V-I-curve of the diode can be linearized, resulting in , where is the differential resistance of the diode. Determine the value of . vii) (2 points) Continuing with the previous question, one can show that the problem of stability for the circuit (c), i.e. the question if the small current perturbations will grow exponentially in time or not, is equivalent to the problem of stability for the circuit (d) (the battery is removed, and the diode is substituted with its differential resistance found by the previous task). What is the largest inductance of wires for which the system is stable?
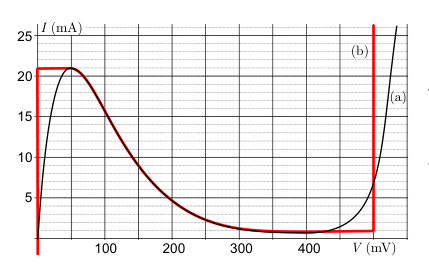 Curva V-I del diodo tunnel
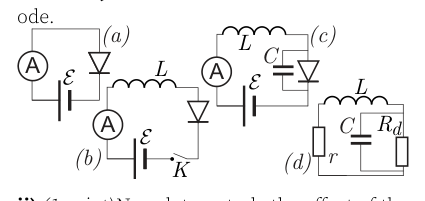 Circuiti (a)(b)(c)(d) con diodo tunnel
Topic: Circuits, Oscillations & Waves Metodi: Kirchhoff’s Laws, Differential Equations, Equivalent Circuit Reduction Competenze: Mathematical Modeling, Diagrammatic Reasoning, Graph Linearization Objects: Battery, Inductor, Capacitor, Switch, Resistor Fonte: Testo (PDF) — p.1
- DIODO TUNELLO (10 punti) Jaan Kalda. La curva V-I di una dioda del tunnel è raffigurata nella figura seguente, curva a). In alcune parti di questo problema, usiamo un modello idealizzato curva (b). I (mA) 5 10 15 20 25 400 300 200 100 V (mV) (b) (a) i) (1 punto) Per misurare la curva V-I di diodo, è collegato in serie con un alimentazione variabile (il valore della forza elettromotrice può essere modificato da per ), cfr. circuito (a). L’ampilometro ha una resistenza interna ; la tensione applicata is . Qual è la tensione di diodo e corrente ? Usa la vera curva di V-I della dioda. L A K (b) A (a) A (c) C (d) C r Rd L L (II) (1 punto) Ora, studiamo l’effetto della l’auto-induzione dei fili. Per prendere in considerazione di tale induttenza, il circuito deve essere modificata come indicato al punto b); let . Il interruttore K è aperto fino a quando la tensione non è regolata a , e poi si chiude. Quanto tempo ci vorrà ? per raggiungere la corrente ? L’abbandono In seguito alla decisione di revocare il regolamento (CE) n. resistenza interna della batteria e della Ammeter (metto ), e utilizzare il V- idealizzato
- Curva I della dioda. iii) (1 punto) Con le stesse impostazioni di compito ii) quanto tempo ci vorrà dal momento in cui quando il interruttore è stato chiuso fino a quando la dioda la tensione raggiunge ? iv) (2 punti) Con lo stesso impatto che per il compito (ii) tracciare la corrente diodo come funzione di tempo e trovare il periodo e l’ampiezza di le oscillazioni correnti. v) (2 punti) Il circuito (b) viene utilizzato per misurare la curva V-I della dioda: per ciascun dato punto, la tensione è regolata al punto desiderato valore mentre il interruttore è aperto, e quindi Il interruttore è chiuso. Si noti che quando il l’ampitore oscilla con una frequenza elevata, mostra la corrente media. - La trama i risultati di misurazione attesi, ovvero: il corrente media attraverso l’ampilometro come funzione della tensione applicata . Vi) (1 punto) Finora abbiamo ipotizzato che La diodo è un dispositivo ideale; in realtà, è ha una piccola capacità parassitaria, lasciamo che sia . In considerazione di questo, il nostro il circuito deve essere disegnato come indicato nel diagramma (c). Ora supponiamo l’ampilometro, di nuovo non ideale, con resistenza interna . Supponiamo che dopo la chiusura il interruttore, la tensione è stata lentamente aumentata da a in modo che un regime di funzionamento fermo (senza oscillazioni) Sono stati raggiunti i valori e . Supponiamo che ci sia una piccola perturbazione corrente e tensione di diodo: e , dove e sono la corrente e la tensione nella stazione di funzionamento regime. per le piccole amplitudini di perturbazione, la curva V-I della dioda può essere linearizzata, che si traduce in , dove è la resistenza differenziale del diodo. Determinazione valore di . (vii) (2 punti) Continuare con il precedente La questione è che si può dimostrare che il problema di stabilità del circuito (c), ovvero La domanda se le piccole perturbazioni di corrente crescere esponenzialmente nel tempo o meno, è equivalente al problema di stabilità del circuito (d) (la batteria viene rimossa e il diodo viene sostituito con la sua resistenza differenziale riscontrata dalla attività precedente). Che cos’è la maggiore induttenza dei fili per i quali il Il sistema è stabile?
Curva V-I del tunnel diodo
Circuito a) b) c) d) con tunnel di diodo
Topic: Circuits, Oscillations & Waves Metodi: Kirchhoff’s Laws, Differential Equations, Equivalent Circuit Reduction Competenze: Mathematical Modeling, Diagrammatic Reasoning, Graph Linearization Objects: Battery, Inductor, Capacitor, Switch, Resistor Fonte: Testo (PDF) — p.1
- CONICAL ROOM (3 points) — Maté Vigh. The interior of a modern museum is a perfect, right cone with half apex angle (i.e. the walls are slanted by with respect to the vertical). Launched from the center of the coneʼs base, the minimal speed needed for a projectile to reach the apex (i.e. the highest point of the walls) is . What is the minimal speed required to reach the wall of the cone?
Topic: Newtonian Mechanics Metodi: Kinematic Equations, Vector Decomposition, Calculus-Integration Competenze: Mathematical Modeling, Physical Reasoning Objects: Projectile Fonte: Testo (PDF) — p.1
- CONICAL ROOM (3 punti) Maté Vigh. L’interno di un museo moderno è un cono perfetto e retto con un angolo medio-apice (cioè le pareti sono inclinate da rispetto a la verticale). Lanciato dal centro di la base del cono, la velocità minima necessaria per un proiettile che raggiunge l’apice (cioè il il punto più alto delle pareti) è . Che cos’è velocità minima necessaria per raggiungere la parete di Il cono?
Topic: Newtonian Mechanics Metodi: Kinematic Equations, Vector Decomposition, Calculus-Integration Competenze: Mathematical Modeling, Physical Reasoning Objects: Projectile Fonte: Testo (PDF) — p.1
- DRONE (9 points) — Lasse Franti and Jaan Kalda. A drone is pulling a cuboid with a rope as shown in the sketch; the cuboid is sliding slowly, with a constant speed, on the horizontal floor. The cuboid is made from an homogeneous material. You may take measurements from the sketch (on a separate page) assuming that the dimensions and distances on it are correct within an unknown scale factor. In order to help you in case you donʼt have access to a printer, and need to read the problem texts directly from the computer screen, some auxiliary dashed lines are shown in the diagram (which might or might not be useful). i) (2 points) Find the coefficient of friction between the cuboid and the floor. ii) (2 points) Find the mass of the cuboid if the mass of the drone is . iii) (2 points) Next we will be studying the flight of a drone in adiabatic atmosphere. In adiabatic atmosphere, air parcels are moving continuously up or down, and while doing so, expand or contract adiabatically. It can be shown that in adiabatic atmosphere, the temperature is a linear function of the height : , where is the temperature on the ground, is the specific heat of air at constant pressure, and . Find the dependence of air density as a function of height, in terms of the density at the ground level (), specific heat of air at constant volume , and other previously defined quantities. iv) (3 points) Assuming that the maximal flight height of a drone with no load is limited by the power of its motor, find if it is known that the power is just enough for the drone to lift a load equal to 50% of its mass off the ground. You may neglect the effect of turbulence on droneʼs thrust.
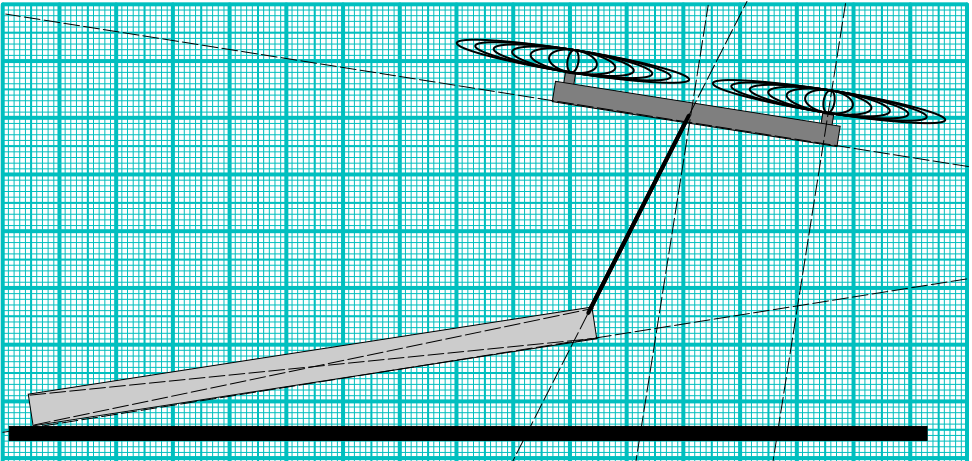 Drone che trascina cuboide con fune
Topic: Newtonian Mechanics, Thermodynamics, Fluid Mechanics Metodi: Free-Body Diagram, Torque & Angular Momentum Analysis, First Law of Thermodynamics, Ideal Gas Law Competenze: Diagrammatic Reasoning, Mathematical Modeling, Physical Reasoning Objects: Block, String Fonte: Testo (PDF) — p.1
- Drone (9 punti) Lasse Franti e Jaan Calda, non è così. Un drone sta tirando un cuboide con una corda Come mostrato nello schizzo; il cuboide si scivola lentamente, con una velocità costante, sul pavimento orizzontale. Il cuboide è realizzato da un materiale omogeneo. È possibile effettuare le misure dal disegno (su una pagina separata) presumendo che le dimensioni e le distanze su di essa sono corrette in una scala sconosciuta fattore. Per aiutarvi nel caso in cui non hanno accesso a una stampante e hanno bisogno di Leggi i testi del problema direttamente dallo schermo del computer, alcune linee a colpi di marchio ausiliari sono (che potrebbe o potrebbe essere non sono utili). i) (2 punti) Trova il coefficiente di attrito tra il cuboide e il pavimento. (ii) (2 punti) Trova la massa del cubo se il la massa del drone è . iii) (2 punti) In seguito si esaminerà il volo di un drone in atmosfera adiabatica. In atmosfera adiabatica, i pacchetti d’aria si muovono continuamente su o giù, e mentre lo fa, espandere o contraere adiabaticamente. - Potrebbe essere dimostrato che nell’atmosfera adiabatica la temperatura è una funzione lineare dell’altezza : , dove è la temperatura sul terreno, è il calore specifico dell’aria a pressione costante, e . Trova la dipendenza di densità dell’aria in funzione dell’altezza, in termini di densità a livello del suolo (), calore specifico dell’aria a volume costante , e altre previamente definite quantità. iv) (3 punti) Supponendo che il massimo di l’altezza di volo di un drone senza carico è limitato dalla potenza del motore, trova se si sa che la potenza è abbastanza per il drone di sollevare un carico pari al 50% della sua massa fuori dal terreno. Potresti trascurare l’effetto della turbolenza sulla spinta del drone.
Doni che trascinano cuboide con fune
Topic: Newtonian Mechanics, Thermodynamics, Fluid Mechanics Metodi: Free-Body Diagram, Torque & Angular Momentum Analysis, First Law of Thermodynamics, Ideal Gas Law Competenze: Diagrammatic Reasoning, Mathematical Modeling, Physical Reasoning Objects: Block, String Fonte: Testo (PDF) — p.1
- BOTTLEʼS SOUND (8 points) — Jaan Kalda and Eero Uustalu. Tools: an empty 1-litre bottle, a small (about 100 ml) cup of known volume (or other tool for measuring water volumes), a smartphone with installed “Physics Toolbox Sensor Suite” or “Physics Toolbox Pro” (mark on your paper, which version did you use). If you blow near the bottleʼs mouth, a whistling sound can be generated: a gentle (to moderately strong) air flow needs to pass the bottleʼs mouth perpendicularly to the bottleʼs axis. Your task is to study the dependence of the frequency of the generated sound as a function of the volume occupied by water inside the bottle. i) (4 points) While blowing near the bottleʼs mouth, measure the sound frequency using either the “tone detector” or “spectrum analyzer” of the “Physics Toolbox” (once the app is launched, the menu can be pulled from the left top corner of the screen). If you manage to obtain a nice distinct sound, use the “tone detector”; otherwise use the “spectrum analyzer” to determine the frequency of the spectrumʼs peak. Tabulate your measurement data. ii) (1 point) Either based on theoretical consideration or on the data analysis, suggest a functional dependence of on . iii) (3 points) Test the validity of your suggestion for this dependence graphically, and determine the parameters of it. Error analysis is not required.
0 5 10 15 20 0 250 500 750 1000 1250 1500 1750 (Pa) 0 150 300 (Pa) (l) (s) (g) 0 0.00 0.25 0.50 0.75 1.00 1.25 1.50 1.75 2.00 (Pa) 0 150 300 (Pa)
Topic: Oscillations & Waves Metodi: Physical Modeling, Experimental Data Analysis, Graph Linearization Competenze: Experimental Data Analysis, Graph Linearization, Mathematical Modeling Objects: Container Fonte: Testo (PDF) — p.2
- Bottle’s Sound (8 punti) Jaan Kalda E Eero Uustalu. Strumenti: un litro vuoto bottiglia, una piccola tazza (circa 100 ml) di acqua nota volume (o altro strumento di misurazione dell’acqua) volume), uno smartphone con installato Fisics Toolbox Sensor Suite o Fisics Toolbox Pro (indicare sulla carta, quale versione ha fatto
- non utilizzate). Se soffri vicino alla bocca della bottiglia, un il suono fischiante può essere generato: un suono delicato (a moderata forza) il flusso d’aria deve passare la bocca della bottiglia perpendicolare alla L’asse della bottiglia. Il vostro compito è studiare la dipendenza della frequenza del il suono in funzione del volume occupato dall’acqua all’interno della bottiglia. i) (4 punti) mentre soffiamo vicino alla bottiglia per la voce, misurare la frequenza sonora utilizzando Il sensore di tono o l’analista di spettro della scatola di strumenti di fisica (una volta che l’app è stata è lanciato, il menu può essere tirato da l’angolo superiore sinistro dello schermo). Se tu il controllo di ottenere un bel suono distinto, uso il rilevatore di tono; altrimenti utilizzare l’analista di spettro per determinare la frequenza di Il picco dello spettro. Tabellare i dati di misurazione. II) (1 punto) Basandosi su considerazioni teoriche o sull’analisi dei dati, suggerire una dipendenza funzionale di da . iii) (3 punti) Testare la validità del vostro suggerimento di questa dipendenza in modo grafico e determinare i parametri di essa. Analisi degli errori non è richiesto.
0 5 10 15 20 0 250 500 750 1000 1250 1500 1750 (Pa) 0 150 300 (Pa) (l) (s) (g) 0 0.00 0.25 0.50 0.75 1.00 1.25 1.50 1.75 2.00 (Pa) 0 150 300 (Pa)
Topic: Oscillations & Waves Metodi: Physical Modeling, Experimental Data Analysis, Graph Linearization Competenze: Experimental Data Analysis, Graph Linearization, Mathematical Modeling Objects: Container Fonte: Testo (PDF) — p.2