PARTE 1 — Misura dell’accelerazione e raccolta dati (Tabella 1)
Una “slitta” di massa variabile è appoggiata su un tavolo orizzontale ed è collegata tramite un filo che scorre su un perno metallico a un corpo di massa costante in caduta. Usando l’app ARDUINO SCIENCE JOURNAL (ASJ) montata sulla slitta, misura l’accelerazione della slitta per almeno 7 valori diversi di , ripetendo ogni misura almeno 4 volte. Registra anche l‘“accelerazione di fondo” (lettura dello smartphone a slitta ferma) e correggila ad ogni prova.
Si può dimostrare che, in assenza di attrito, l’accelerazione teorica della slitta sarebbe:
dove è la massa del corpo trainante (costante), la massa della slitta, l’accelerazione di gravità. L’accelerazione misurata risulta minore di per la presenza dell’attrito.
Riporta nella Tabella 1 (foglio dati):
- numero di registrazione
- massa della slitta (in kg)
- accelerazione di fondo (in m/s²)
- accelerazione corretta per il fondo (in m/s²)
Per ogni grandezza indica la sensibilità dello strumento usato (bilancia e accelerometro) e le corrette unità di misura S.I.
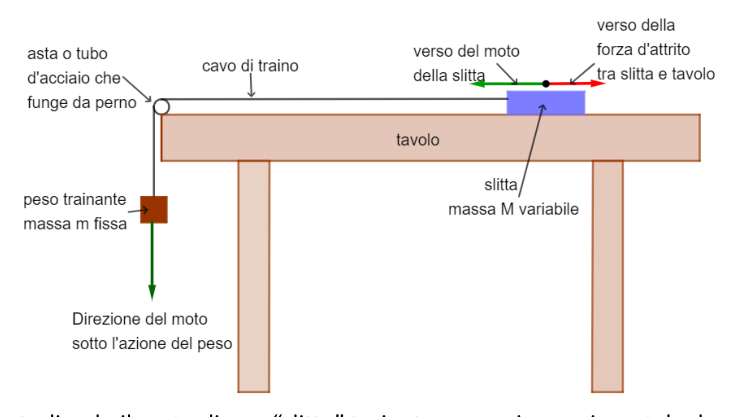 Schema slitta su tavolo con peso trainante
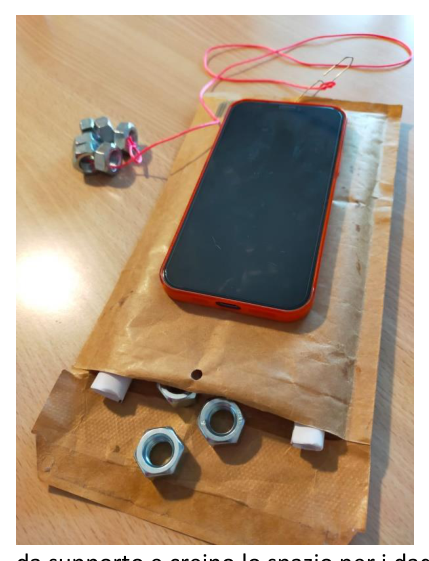 Orientamento smartphone sulla slitta
Topic: Newtonian Mechanics Metodi: Free-Body Diagram, Kinematic Equations, Experimental Data Analysis Competenze: Measurement & Instrumentation, Experimental Data Analysis Objects: String, Block Fonte: Testo (PDF) — p.13
PART 1 — Measurement of Acceleration and Data Collection (Table 1)
A “sled” of variable mass is placed on a horizontal table and connected via a string passing over a metal pin to a body of constant mass undergoing free fall. Using the ARDUINO SCIENCE JOURNAL (ASJ) app mounted on the sled, measure the acceleration of the sled for at least 7 different values of , repeating each measurement at least 4 times. Also record the “background acceleration” (smartphone reading when the sled is stationary) and subtract it from each measurement.
It can be shown that, in the absence of friction, the theoretical acceleration of the sled would be:
where is the mass of the pulling body (constant), is the sled’s mass, is the acceleration due to gravity. The measured acceleration turns out to be less than due to the presence of friction.
Record in Table 1 (data sheet):
- recording number
- sled mass (in kg)
- background acceleration (in m/s²)
- corrected acceleration (in m/s²)
For each quantity, indicate the instrument’s sensitivity (balance and accelerometer) and use correct SI units.
Diagram of sled on table with hanging pulling mass
Smartphone orientation on the sled
PARTE 2 — Elaborazione dati e calcolo di (Tabella 2)
Utilizzando i dati della Tabella 1, per ogni valore di massa della slitta calcola:
-
L’accelerazione teorica (senza attrito):
-
La media delle accelerazioni efficaci misurate e la relativa semidispersione massima come incertezza.
-
La variazione dell’accelerazione:
-
La forza d’attrito:
-
La forza premente della slitta:
-
Il coefficiente d’attrito radente dinamico:
Riporta tutti i risultati con le corrette unità di misura S.I. e il numero di cifre significative appropriato.
Inoltre, spiega come hai determinato le incertezze sulle varie misure (sia relative ai dati della Tabella 1 che a quelli della Tabella 2). Calcola infine il valore medio ottenuto al variare di .
Topic: Newtonian Mechanics Metodi: Conservation Laws, Error Propagation, Statistical Averaging, Physical Modeling Competenze: Error Propagation, Experimental Data Analysis Objects: Block Fonte: Testo (PDF) — p.17
PARTE 2 — Elaborazione dati e calcolo di (Tabella 2)
Using the data in Table 1, for each mass value of the sled, it is calculated:
-
Theoretical acceleration (without friction):
-
The mean of the effective accelerations measured and the relative maximum half-dispersion as uncertainty.
-
The change in acceleration:
-
The force of friction:
-
The pressure of the sled:
-
The dynamic friction coefficient:
Report all results with the correct SI units. and the appropriate number of significant figures.
In addition, explains how you determined the uncertainties on the various measures (both Table 1 and Table 2). Finally, the mean obtained from the variable is calculated.
Topic: Newtonian Mechanics Metodi: Conservation Laws, Error Propagation, Statistical Averaging, Physical Modeling Competenze: Error Propagation, Experimental Data Analysis Objects: Block Fonte: Testo (PDF) — p.17
PARTE 3 — Grafico forza d’attrito vs forza premente e determinazione di
Con i dati della Tabella 2 costruisci su carta millimetrata un grafico ponendo in ascisse la forza premente della slitta (in N) e in ordinate la forza d’attrito (in N). Riporta sugli assi le grandezze con le rispettive unità di misura. I dati devono occupare almeno dello spazio disponibile per ogni asse. Traccia le barre d’errore e la retta di interpolazione (che deve passare per l’origine).
In base al grafico:
(a) Scrivi la relazione che trovi tra e .
(b) Ricava dalla relazione scritta il coefficiente d’attrito dinamico come coefficiente angolare della retta, indicando anche l’intervallo di valori possibili ottenuto dalle rette di massima e minima pendenza passanti per tutte le barre d’errore.
(c) Confronta il valore di ottenuto dal grafico con quello calcolato algebricamente nella Parte 2. I risultati sono compatibili (cioè gli intervalli di incertezza si sovrappongono almeno parzialmente)? Spiega.
Topic: Newtonian Mechanics Metodi: Graph Linearization, Error Propagation, Physical Modeling, Experimental Data Analysis Competenze: Graph Linearization, Experimental Data Analysis Objects: — Fonte: Testo (PDF) — p.20
PART 3 Graph of friction force vs pressure force and determination of
Using the data in Table 2, build on millimeter paper a graph by summing the pressure force of the sled (in N) and the friction force (in N). Report the dimensions with their respective units of measurement on the axes. The data shall occupy at least of the available space for each axis. Trace the error bars and the line of interpolation (which must pass through the source).
The following table shows the number of samples taken:
(a) Write down the relationship between and .
(b) Draw from the written report the dynamic friction coefficient as the angular coefficient of the straight, including the range of possible values obtained from the maximum and minimum slope lines passing through all the error bars.
(c) Compare the value of from the graph to the algebraically calculated value in Part 2. Are the results compatible (i.e. are the uncertainty ranges at least partially overlapping)? - Explain that.
Topic: Newtonian Mechanics Metodi: Graph Linearization, Error Propagation, Physical Modeling, Experimental Data Analysis Competenze: Graph Linearization, Experimental Data Analysis Objects: — Fonte: Testo (PDF) — p.20