Hall effect and magnetoresistivity effect
Apparatus and materials
-
Three digital multimeters.
-
A Hall sensor with four pins MNPQ (M in black wire, N yellow wire, P red wire, Q green wire), fixed on a printed circuit, a pair of conductors leading to M, N; another pair of conductors leading to P, Q.
-
A permanent magnet in the shape of a disk, of radius , of thickness . The magnetization is perpendicular to the surface of the disk. The value (in Tesla) of the magnetic field at the surface of the magnet is written on the magnet’s surface.
During the experiment, keep the magnet far away from the Hall sensor whenever you do not use it.
-
A coil of turns is wound on a core having the shape of a toroid, made of a ferromagnetic material. The average diameter of the core is . The toroid has a gap of width .
-
A box with two independent 1.5 V dry cells. The cell connected in series to a 10 kΩ variable resistor, called battery 1, is used to supply the current to the Hall sensor. The second cell, called battery 2, is used to supply the current to the coil only during the measurement.
-
A protractor with a small hole at its center.
-
A piece of plexiglass with a small needle fixed on it.
-
A holder for the printed circuit with the Hall sensor.
-
A small piece of plastic used to fix the sensor on the needle.
-
Conductors with negligible resistance.
-
Graph papers.
Figure 1 — Apparatus layout
Numbered items: 1 — digital multimeters; 2 — protractor; 3 — magnet; 4 — printed circuit with the Hall sensor; 5 — box with the two dry cells; 6 — plexiglass with the needle; 7 — graph paper; 8 — holder for the printed circuit; 9 — sensor mount. A 10 kΩ variable resistor is indicated at the top left.
Experiment
I. Introduction
1. The magnetoresistivity effect and the Hall effect.
Consider a conductor sample in the shape of a parallelepiped of length , width and thickness (see Figure 2). The current flows along the direction of . If the sample is placed in a magnetic field , the magnetic field affects the resistance of the sample. This effect is called the magneto-resistivity effect (MRE). Let be the increase of the resistance of the sample, the value of the resistance in the absence of a magnetic field, then the magnitude of the MRE is defined by the ratio .
Figure 2 — Sample geometry
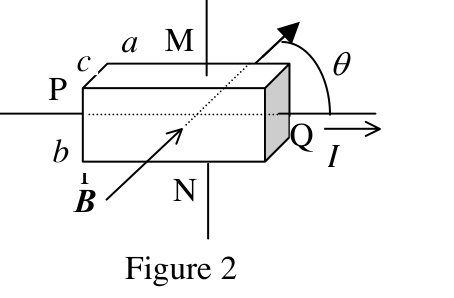
Assume that the applied magnetic field is uniform and the magnetic induction vector is parallel to the top face of the sample as shown in Figure 2. If the charge carriers in the sample are electrons, the Lorentz force will bend them upward, and the top face of the sample will be charged negatively. This effect is called the Hall effect. The voltage appearing between electrodes M (on the top face) and N (on the bottom face) is called the Hall voltage. This can be measured by use of a voltmeter.
The potential difference measured between the electrodes M and N is given by
U_{MN} = U_H + V_{MN} \tag{1}
where is the Hall voltage, is the potential difference in the absence of a magnetic field due to some undesired effects (the electrodes M and N being not exactly opposite to each other, etc.).
Normally, the Hall voltage is proportional to , and the magnitude of the MRE is proportional to , where is the angle between vector and the current direction. But when the sample has a non regular shape, the dependence of and on may be more complicated.
The Hall effect is used to fabricate a device for measuring the magnetic field. This device is called the Hall sensor. For a Hall sensor, the expression of is given by:
U_H = \alpha\,I\,B\,\sin\theta \tag{2}
where is, by definition, the sensitivity of the Hall sensor.
II. The measuring sample
The measuring sample in this experiment is a commercial Hall sensor. It consists of a small thin semiconductor plate covered with plastic, with 4 ohmic electrodes, leading to the pins M, N, P, Q (see Figure 3). It is used in this experiment to study both the MRE and the Hall effect.
Figure 3 — Commercial Hall sensor (pin layout)

Place the sensor in the magnetic field and use an ohmmeter to measure the resistance between pins M and N, we can deduce the magnitude of the MRE. Set a current () flowing from P to Q, we can study the Hall effect by measuring the voltage between M and N with a millivoltmeter.
III. Experiment
1. Determination of the sensitivity of the Hall sensor
Set the current through the sensor . Keep the distance between the sensor and the centre of the surface of the magnet . Adjust the orientation of the magnet to obtain maximal value of the Hall voltage. Measure the Hall voltage with some values of and determine the sensitivity of the Hall sensor.
For a magnet having the shape of a disk of radius , thickness , the magnetic field at a point situated on its axis at a distance from the center of the disk surface with is given by the expression
B(y) = \frac{1}{2}B_0\left[\frac{y+t}{\sqrt{(y+t)^2 + r^2}} - \frac{y}{\sqrt{y^2 + r^2}}\right] \tag{1}
where is the magnetic induction at the surface of the magnet. The value of is given on the surface of the magnet.
[2.0 pts]
2. Study of the dependence of on angle between and the current direction.
Set the current through the sensor . Keep the distance between the sensor and the centre of the surface of the magnet . Put the magnet on the protractor so that the plane of the magnet is perpendicular to the line connecting the sensor and centre of the magnet.
a. Draw a sketch of the experimental arrangement.
b. Tabulate the values of for in the range of .
c. Verify the proportionality between and by using a graph plotted in an appropriate way.
[2.5 pts]
3. Study of the dependence of on , for perpendicular to the sample plane.
The MRE is significant only at sufficiently strong magnetic field. So it is recommended to use a magnetic field as strong as possible.
a. Draw a sketch of the experimental arrangement and explain the principle of the measurements.
b. Perform measurements and tabulate the data.
c. Assume that , determine the value of by using a graph plotted in an appropriate way. Estimate the maximal deviation of the obtained value of .
[4.0 pts]
4. Determination of the relative permeability of the ferromagnetic materials of the core of the toroidal coil
Determine the relative permeability of the core material at the measured current intensity by following this guidance step by step:
- Put the Hall sensor into the gap on the core.
- Connect the coil and an ammeter to battery 2. Use only the inputs COM and 20A of the ammeter in this case.
- Measure the current in the coil and the magnetic field in the gap.
- Calculate the value of .
You can use the following relation:
[1.5 pts]
Fonte: Testo (PDF) — p.1 Topic: Magnetism, Electromagnetism Metodi: Experimental Data Analysis, Lorentz Force Analysis, Graph Linearization, Error Propagation Competenze: Experimental Data Analysis, Measurement & Instrumentation, Graph Linearization, Error Propagation Objects: Magnet, Coil
Effetto Hall e effetto magnetoresistività
Apparecchi e materiali
- Tre multimetri digitali.
- Un sensore Hall con quattro pin MNPQ (M in filo nero, N in filo giallo, P in filo rosso, Q in filo verde), fissato su un circuito stampato, una coppia di conduttori che portano a M, N; un altro paio di conduttori che portano a P, Q.
- Magnete permanente a forma di disco, di raggio , di spessore . La magnetizzazione è perpendicolare alla superficie del disco. Il valore (in Tesla) del campo magnetico alla superficie del magnete è scritto sulla superficie del magnete.
Durante l’esperimento, tenete il magnete lontano dal sensore Hall ogni volta che non lo utilizzate. 4. Una bobina di giri è avvolta su un nucleo a forma di toroide, realizzato in materiale ferromagnetico. Il diametro medio del nucleo è . Il toroide ha un intervallo di larghezza . 5. Una scatola con due celle secche indipendenti da 1,5 V. La cella collegata in serie a una resistenza variabile da 10 kΩ, denominata batteria 1, viene utilizzata per fornire la corrente al sensore Hall. La seconda cella, denominata batteria 2, viene utilizzata per fornire la corrente alla bobina solo durante la misura. 6. Un prolungatore con un piccolo buco al centro. 7. Un pezzo di plexiglass con un piccolo ago fissato su di esso. 8. Un supporto per il circuito stampato con il sensore Hall. 9. Un piccolo pezzo di plastica utilizzato per fissare il sensore sull’ago. 10. Conduttori con una resistenza trascurabile. 11. - Carta grafica.
[fig.] Figura 1 Disegno dell’apparecchio
# Esperimento
I. Introduzione
1. L’effetto magnetoresistività e l’effetto Hall.
Si consideri un campione di conduttore a forma di parallelepiped di lunghezza , larghezza e spessore (vedi figura 2). La corrente scorre lungo la direzione . Se il campione è collocato in un campo magnetico , il campo magnetico influisce sulla resistenza del campione. Questo effetto è chiamato effetto ** magnetorresistenza (MRE) **. Se è l’aumento della resistenza del campione, è il valore della resistenza in assenza di un campo magnetico, allora la magnitudine del MRE è definita dal rapporto .
Figura 2 Geometria campione
Supponiamo che il campo magnetico applicato sia uniforme e che il vettore di induzione magnetica sia parallelo alla superficie superiore del campione come mostrato nella figura 2. Se i vettori di carica del campione sono elettroni, la forza di Lorentz li piegarà verso l’alto e la superficie superiore del campione sarà carica negativa. Questo effetto è chiamato effetto Hall. La tensione che appare tra gli elettrodi M (sulla superficie superiore) e N (sulla superficie inferiore) è chiamata tensione di sala. Questo può essere misurato con un voltmeter.
La differenza di potenziale misurata tra gli elettrodi M e N è data da
U_{MN} = U_H + V_{MN} \tag{1}
se è la tensione Hall, è la differenza potenziale in assenza di campo magnetico a causa di alcuni effetti indesiderati (l’elettrodo M e N non sono esattamente opposti tra loro, ecc.).
Normalmente, la tensione di Hall è proporzionale a , e la magnitudine del MRE è proporzionale a , dove è l’angolo tra il vettore e la direzione corrente. Ma quando il campione ha una forma non regolare, la dipendenza di e da può essere più complicata.
L’effetto Hall viene utilizzato per fabbricare un dispositivo per misurare il campo magnetico. Questo dispositivo è chiamato sensore Hall. Per un sensore Hall, l’espressione è data da:
U_H = \alpha\,I\,B\,\sin\theta \tag{2}
dove è, per definizione, la sensibilità del sensore Hall.
II. Il campione di misurazione
Il campione di misurazione in questo esperimento è un sensore commerciale Hall. È costituito da una piccola sottile piastra semiconduttrice coperta di plastica, con 4 elettrodi ohmici, che portano ai pin M, N, P, Q (vedi figura 3). È usato in questo esperimento per studiare sia l’effetto MRE che l’effetto Hall.
[fig.] Figura 3 Sensore della Sala Commerciale (disegno del pin)
Mettiamo il sensore nel campo magnetico e usiamo un ohmmeter per misurare la resistenza tra i pin M e N, possiamo dedurre la magnitudine del MRE. Impostare una corrente () che scorre da P a Q, possiamo studiare l’effetto Hall misurando la tensione tra M e N con un milivoltmeter.
# III. Esperimento
1. Determinazione della sensibilità del sensore Hall
Impostare la corrente attraverso il sensore . Tenere la distanza tra il sensore e il centro della superficie del magnete . Adeguare l’orientamento del magnete per ottenere il valore massimo della tensione Hall. Misurare la tensione Hall con alcuni valori di e determinare la sensibilità del sensore Hall.
Per un magnete con forma di disco di raggio , spessore , il campo magnetico in un punto situato sul suo asse a distanza dal centro della superficie del disco con è indicato con l’espressione
B(y) = \frac{1}{2}B_0\left[\frac{y+t}{\sqrt{(y+t)^2 + r^2}} - \frac{y}{\sqrt{y^2 + r^2}}\right] \tag{1}
dove è l’induzione magnetica alla superficie del magnete. Il valore di è indicato sulla superficie del magnete.
[2,0 pts]
2. Studi sulla dipendenza di da un angolo tra e la direzione corrente.
Impostare la corrente attraverso il sensore . Tenere la distanza tra il sensore e il centro della superficie del magnete . Mettete il magnete sul prolungatore in modo che il piano del magnete sia perpendicolare alla linea che collega il sensore e il centro del magnete.
a. Disegna uno schema dell’arrangimento sperimentale.
b. Tabulare i valori di per nell’intervallo di .
c. Verificare la proporzionalità tra e utilizzando un grafico tracciato in modo appropriato.
[2,5 pts]
3. Studi sulla dipendenza di da per perpendicolare al piano del campione.
Il MRE è significativo solo a un campo magnetico sufficientemente forte. Quindi si consiglia di usare un campo magnetico il più forte possibile.
a. Disegnare uno schema dell’arredamento sperimentale e spiegare il principio delle misurazioni.
b. Eseguire misure e tabulare i dati.
c. Supponiamo che , determinare il valore di utilizzando un grafico tracciato in modo appropriato. Calcolare la deviazione massima del valore ottenuto di .
[4.0 pts]
4. Determinazione della permeabilità relativa dei materiali ferromagnetici del nucleo della bobina toroidale
Determinare la relativa permeabilità del materiale di base all’intensità di corrente misurata seguendo step by step questa guida:
- Metti il sensore Hall nel vuoto del nucleo.
- Collegare la bobina e un ammetro alla batteria 2 MSK1/>. In questo caso utilizzare solo le entrate COM e 20A dell’ampilometro.
- Misurare la corrente nella bobina e il campo magnetico nel gap.
- Calcolare il valore di .
È possibile utilizzare la seguente relazione:
[1,5 pts]
Fonte: Testo (PDF) — p.1 Topic: Magnetism, Electromagnetism Metodi: Experimental Data Analysis, Lorentz Force Analysis, Graph Linearization, Error Propagation Competenze: Experimental Data Analysis, Measurement & Instrumentation, Graph Linearization, Error Propagation Objects: Magnet, Coil
Black box
Apparatus and materials
- A double beam oscilloscope.
- A function generator capable to generate sine, triangle and square waves over the 0.02 Hz to 2 MHz range.
- A “Black box” with two groups of connectors: the ABCD group and A’B’C’D’ group. Besides, there are also two connectors for the standard resistor , which is isolated from the two groups.
- Conductors of negligible resistance.
- Graph paper.
Warning: You are not allowed to open the black box.
Experiment
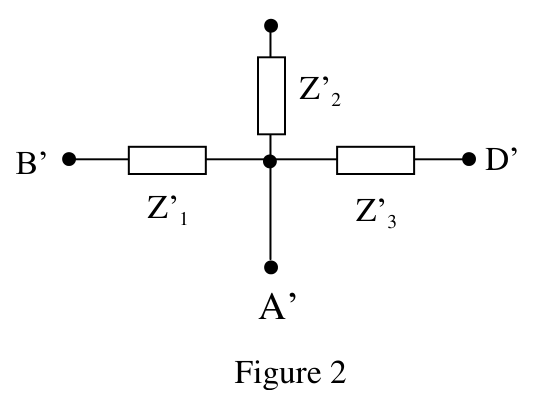
In the black box, there are two groups of passive elements (that are elements of the types: resistor , capacitor or inductor (induction coil) ). The first group consists of three elements , , , connected in a star circuit as shown in Figure 1. The elements are led out to the connectors A, B, C and D, with A — the common connector of the ABCD group. The second group consists of three elements , , connected in the same manner to connectors A’, B’, C’ and D’, with A’ — the common connector of the A’B’C’D’ group (see Figure 2).
Figure 1 — First group (ABCD star)
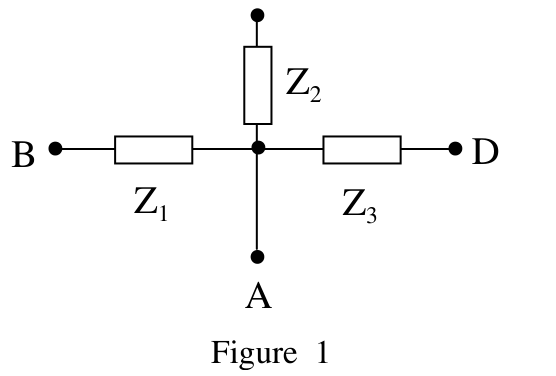
Figure 2 — Second group (A'B'C'D' star)
-
By using the oscilloscope and the function generator, determine the type and the parameter (that is resistance of , capacity of , inductivity of ) of each of the elements , , and , , .
[5.0 pts]
-
Connect five points B, C, B’, C’ and D’ together. We obtain a new black box with terminals DD’A’ (called DD’A’).
a. Draw the electric circuit of this black box.
b. Apply a sine wave from the generator to connectors D and A’. Plot a graph of the ratio of the voltage amplitudes and the phase shift between these voltages as functions of the frequency of the signal.
c. The graphs possess a particular point at a certain frequency . Determine the value of the frequency , the ratio and the phase shift at this frequency.
d. Derive the relation between and the parameters of the elements in the black box and calculate the values of .
[5.0 pts]
Fonte: Testo (PDF) — p.1 Topic: Circuits, Electromagnetism Metodi: Experimental Data Analysis, Equivalent Circuit Reduction, Kirchhoff’s Laws, Graph Linearization Competenze: Experimental Data Analysis, Measurement & Instrumentation, Diagrammatic Reasoning, Physical Reasoning Objects: Resistor, Capacitor, Inductor
# scatola nera
Apparecchi e materiali
- Un osciloscopio a doppio raggio.
- Un generatore di funzioni in grado di generare onde sinusoide, triangolari e quadrate nell’intervallo da 0,02 Hz a 2 MHz.
- Una “scatola nera” con due gruppi di connettori: il gruppo ABCD e il gruppo A’B’C’D’. Inoltre, sono presenti anche due connettori per la resistenza standard , che è isolata dai due gruppi.
- Conduttori di resistenza trascurabile.
- Carta grafica.
**Avvertimento: ** Non è consentito aprire la casella nera.
# Esperimento
Nella scatola nera, ci sono due gruppi di elementi passivi (che sono elementi di tipo: resistore , condensatore o induttore (coil di induzione) ). Il primo gruppo è costituito da tre elementi , , , collegati in un circuito stellare come mostrato alla figura 1. Gli elementi sono condotti ai connettori A, B, C e D, con A il connettore comune del gruppo ABCD. Il secondo gruppo è costituito da tre elementi , , collegati allo stesso modo ai connettori A’, B’, C’ e D’, con A’ il connettore comune del gruppo A’B’C’D’ (vedere figura 2).
[figura] Figura 1 Primo gruppo (aereo ABCD)
[figura] Figura 2 Secondo gruppo (a’B’C’D’ stella)
- Utilizzando l’oscilloscopio e il generatore di funzioni, determinare il tipo e il parametro (cioè resistenza di , capacità di , induttività di ) di ciascuno degli elementi , , e , , .
[5,0 pts]
-
Collegare i cinque punti B, C, B’, C’ e D’ insieme. Abbiamo ottenuto una nuova scatola nera con i terminali DD’A’ (chiamato DD’A’).
a. Disegna il circuito elettrico di questa scatola nera.
b. Applicare un’onda sinusa dal generatore ai connettori D e A’. Tracciare un grafico del rapporto delle amplitudini di tensione e il passaggio di fase tra tali tensioni come funzioni della frequenza del segnale.
c. I grafici hanno un punto particolare a una certa frequenza . Determinare il valore della frequenza , il rapporto e il cambiamento di fase a questa frequenza.
d. Derivare la relazione tra e i parametri degli elementi nella casella nera e calcolare i valori di .
[5,0 pts]
Fonte: Testo (PDF) — p.1 Topic: Circuits, Electromagnetism Metodi: Experimental Data Analysis, Equivalent Circuit Reduction, Kirchhoff’s Laws, Graph Linearization Competenze: Experimental Data Analysis, Measurement & Instrumentation, Diagrammatic Reasoning, Physical Reasoning Objects: Resistor, Capacitor, Inductor