Sliding Snails
Imagine a human walking on perfectly flat ground. With each step they accelerate and decelerate.
1a) Which force is responsible for this acceleration and deceleration?
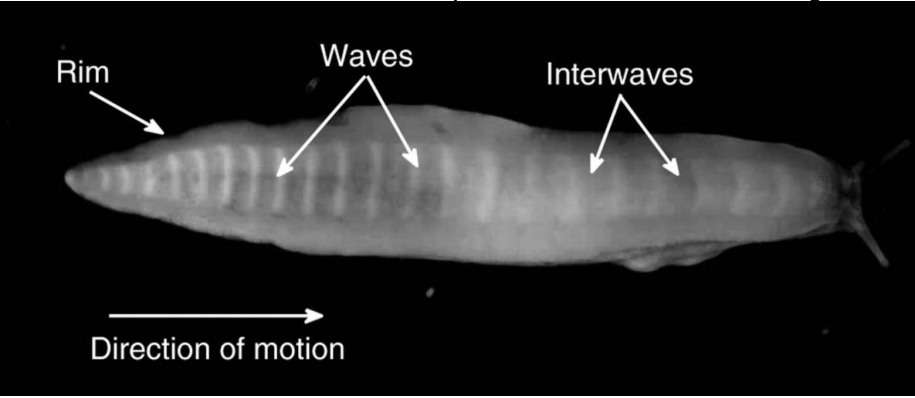
The underneath of a snail is called a foot. When a snail is backlit and travels across a surface, light regions called ‘waves’ and dark regions called interwaves can be observed in the snail’s foot moving from its tail to its head. The rim refers to the outer part of the snail’s foot. See the diagram below.
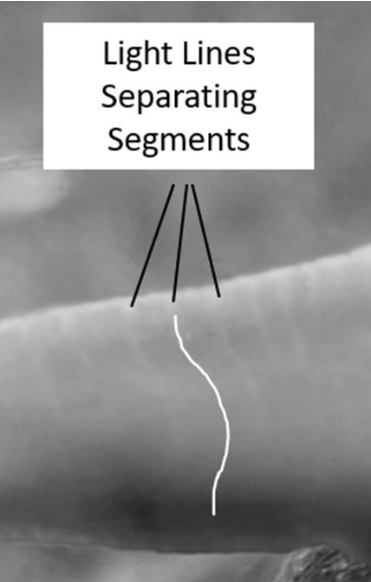
The snail is made up of segments separated by thin lines. These can be seen in the diagram below. In the diagram a white line highlights one of these thin lines between segments.
The following can be observed as the snail moves forwards.
- The thin lines move toward the front of the snail when a wave passes.
- The thin lines move towards the back of the snail when an interwave passes.
- There is significantly less movement in the rim.
1b) Based on these observations, which part(s) of the snail’s foot are stationary with respect to the glass as it slides? Using evidence, justify your answer.
Scientists have measured the displacement, velocity and acceleration of a segment of a snail foot relative to the glass as a wave passes through it. The graph below shows the displacement over time for one segment cycle.
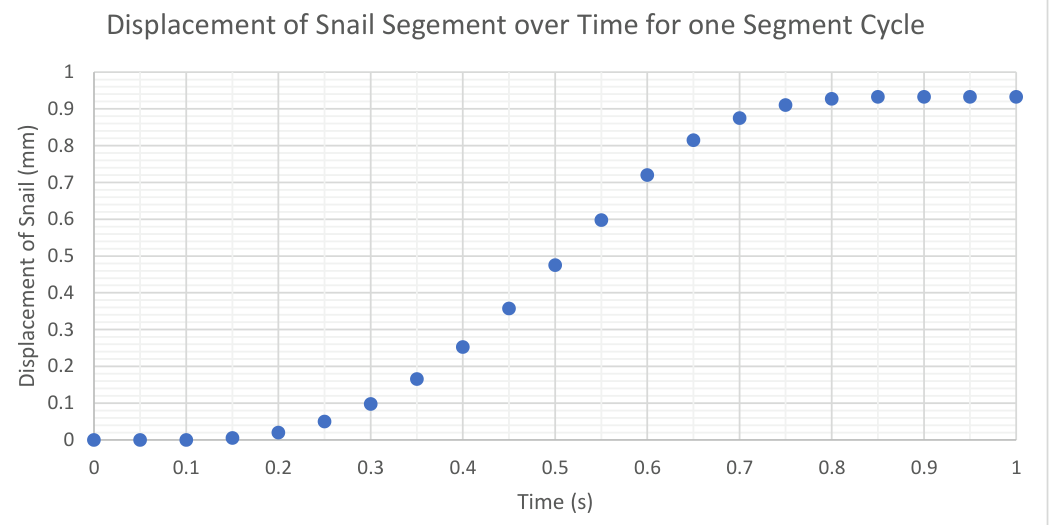
1c) Using this graph calculate the maximum velocity of the snail relative to the glass throughout this motion. Show your working.
The graph below shows the acceleration of a segment of snail relative to the glass as a wave passes through that segment.
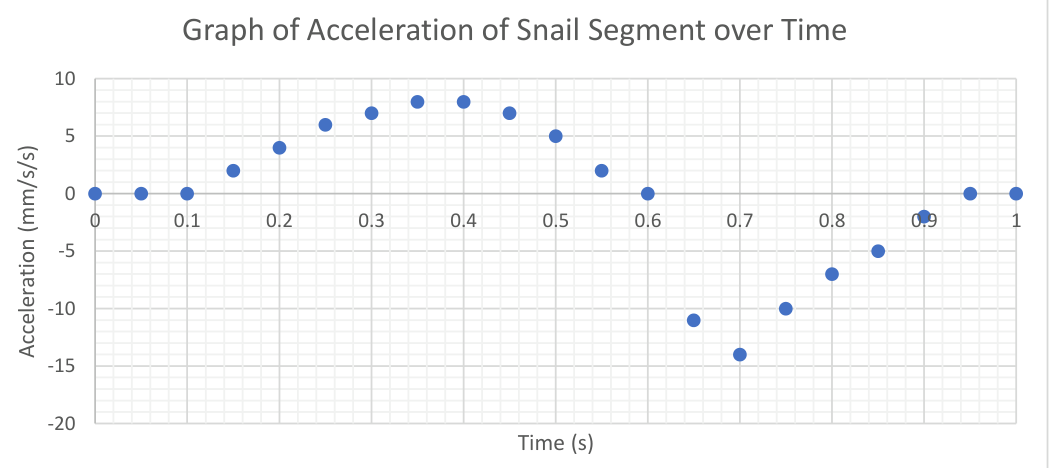
1d) Using this acceleration graph calculate the maximum velocity of the snail relative to the glass throughout this motion. Show your working. Does your answer agree with your answer to part c?
1e) Create a sketch of the snail segment velocity of the snail over time.
For questions f and g, evaluate if the following statements are true or false. Provide evidence for your claims.
1f) The pressure associated with the normal force between the snail and the glass is maximum in the wave regions and minimum in the interwave regions.
1g) The average speed of the snail relative to the glass is faster than the average speed of the waves passing through the snail relative to the glass.
Risposta: a) friction; b) the interwave regions; c), d) –; f) false; g) false
Soluzione:
1a) Friction.
1b) In order to propel itself forward the snail must apply a backwards force on the glass. This must occur at a point which is moving backwards relative to the snail (the interwave). To avoid slipping (like a human on ice) there must be traction/no relative motion between the interwave and the glass. Since segments of the snail that are in wave and rim sections are moving relative to the interwave sections these cannot be stationary relative to the glass.
1c) Choose two points between and to calculate the maximum gradient. The value obtained is between and .
1d) Approximate the area between the curve and the -axis either before or after . The value obtained is between and ; state whether the two values agree or disagree.
1e) The answer should look something like this:
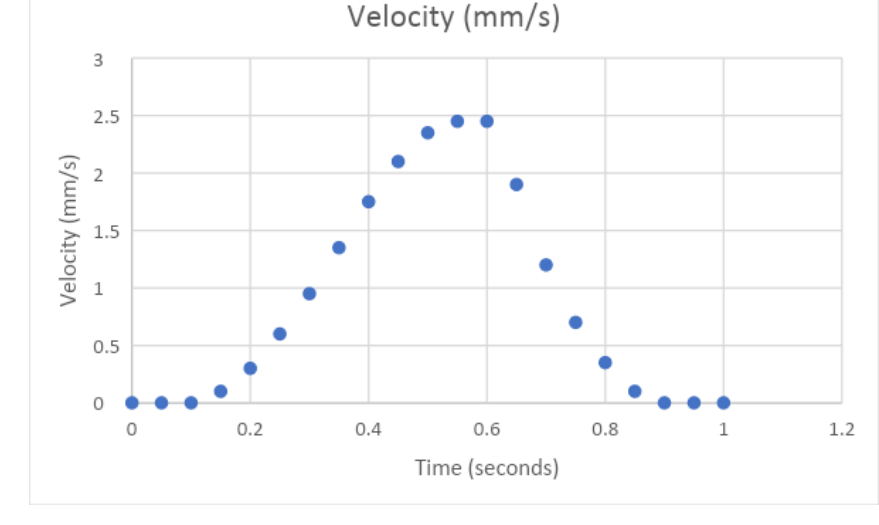
1f) The snail moves forwards by having traction in the interwave regions, therefore the normal-force pressure must be largest in these regions. The statement is false.
1g) The velocity–time graph shows that a segment of the snail moves with the wave as it passes through the segment; the segment is then stationary when the interwave region passes through it. Therefore the average speed of the segments is slower than the speed of the waves. The statement is false.
Official answers (Australian Science Innovations, 2025 ASO Physics Exam with Answers), from the official PDF. © Australian Science Innovations.
Topic: Newtonian Mechanics, Biology Metodi: Kinematic Equations, Free-Body Diagram, Experimental Data Analysis Competenze: Experimental Data Analysis, Physical Reasoning, Diagrammatic Reasoning Objects: — Fonte: Testo (PDF) — p.3 · Soluzione ufficiale (PDF) — p.3
Lumache che scivolano
Immagina una persona che cammina su un terreno perfettamente piano. A ogni passo accelera e decelera.
1a) Quale forza è responsabile di questa accelerazione e decelerazione?
La parte inferiore di una lumaca si chiama piede. Quando una lumaca è illuminata da dietro e si muove su una superficie, nel piede si osservano regioni chiare, dette «onde», e regioni scure, dette «interonde», che si spostano dalla coda verso la testa. Il bordo è la parte esterna del piede della lumaca. Vedi il diagramma qui sotto.
La lumaca è formata da segmenti separati da linee sottili, visibili nel diagramma qui sotto. Nel diagramma una linea bianca evidenzia una di queste linee sottili tra due segmenti.
Mentre la lumaca avanza si osserva che:
- le linee sottili si spostano verso la parte anteriore della lumaca quando passa un’onda;
- le linee sottili si spostano verso la parte posteriore della lumaca quando passa un’interonda;
- nel bordo il movimento è molto minore.
1b) In base a queste osservazioni, quale o quali parti del piede della lumaca sono ferme rispetto al vetro mentre la lumaca scivola? Giustifica la risposta con le evidenze.
Alcuni scienziati hanno misurato lo spostamento, la velocità e l’accelerazione di un segmento del piede di una lumaca rispetto al vetro mentre un’onda lo attraversa. Il grafico seguente mostra lo spostamento in funzione del tempo per un ciclo del segmento.
1c) Usando questo grafico calcola la velocità massima della lumaca rispetto al vetro durante il moto. Mostra i passaggi.
Il grafico seguente mostra l’accelerazione di un segmento della lumaca rispetto al vetro mentre un’onda attraversa quel segmento.
1d) Usando questo grafico dell’accelerazione calcola la velocità massima della lumaca rispetto al vetro durante il moto. Mostra i passaggi. La risposta è in accordo con quella del punto c?
1e) Disegna un grafico qualitativo della velocità del segmento della lumaca in funzione del tempo.
Per i punti f e g stabilisci se le affermazioni sono vere o false, motivando con delle evidenze.
1f) La pressione associata alla forza normale tra la lumaca e il vetro è massima nelle regioni d’onda e minima nelle regioni d’interonda.
1g) La velocità media della lumaca rispetto al vetro è maggiore della velocità media, rispetto al vetro, delle onde che attraversano la lumaca.
Risposta: a) l’attrito; b) le regioni d’interonda; c), d) –; f) falsa; g) falsa
Soluzione: La soluzione ufficiale completa (in inglese) è nella versione originale di questo quesito e nel PDF ufficiale.
Topic: Newtonian Mechanics, Biology Metodi: Kinematic Equations, Free-Body Diagram, Experimental Data Analysis Competenze: Experimental Data Analysis, Physical Reasoning, Diagrammatic Reasoning Objects: — Fonte: Testo (PDF) — p.3 · Soluzione ufficiale (PDF) — p.3
Practicals with Paper
This exam booklet is (hopefully) made of A4 paper. Typical office paper has a thickness defined by 80 grams per square meter. An A4 sheet of paper has a defined size and is part of the A-series of paper, which also includes A3 or A5 paper. These paper size regulations are defined by the ISO 216 standard. The A-series of paper has a few intriguing properties:
- Every size in the series has the same ratio of long edge to short edge.
- If you join two sheets of the same size along the long edge, you get the paper that is the next up in the series. For example, two A4 pieces of paper joined along the long edge gives an A3 page.
- A0 paper has an area of exactly 1 square meter.
2a) Calculate the length and width of an A4 piece of paper to 4 significant figures.
2b) The mass of a typical A4 sheet of paper is . What is the integer exponent ?
2c) Estimate the density of the paper comprising this exam booklet. Briefly explain your method and calculations, and include an estimate of the uncertainty in your measurement.
When two surfaces move past each other while in contact, they experience a friction force that acts to oppose the motion. The magnitude of the frictional force between two surfaces sliding past one another is given by where is the normal force between the two surfaces and is the coefficient of kinetic friction, a measure of ‘roughness’ between the two surfaces.
2d) Austin has designed an experiment to measure the coefficient of kinetic friction between paper and paper. The method he used is outlined below.
- Take a wooden plank with the top surface covered with paper and place it against the wall at some angle to the ground.
- Place paper along the ground after the ramp.
- Wrap a mass in paper and let it slide from rest, starting at the top of the plank.
- Measure the distance between the end of the ramp and the final position of the mass.
- Repeat for different angles of the ramp.
The data Austin collected is shown in the table below. Unfortunately, he did not get time to finish the analysis of the data. Complete the table and plot an appropriate graph to determine the coefficient of friction. Briefly comment on the validity of the result. If you can, also determine the length of the ramp used, .
Hint: derive an equation linking and , and other constants, and linearise by writing it in the form where , depend on and , and and are constants.
| (°) | 35 | 40 | 45 | 50 | 55 | 60 | 65 | 70 | 75 | 80 |
|---|---|---|---|---|---|---|---|---|---|---|
| (cm) | 6 | 23 | 47 | 61 | 75 | 94 | 120 | 129 | 142 | 162 |
An object, like an A4 piece of paper, moving through a fluid such as air, experiences a drag force that acts opposite to the direction of motion with magnitude where is the density of the fluid, is the surface area of the object perpendicular to the motion, is the speed of the object and is the dimensionless drag coefficient, which depends on the material and geometry. An object which experiences a significant drag force will accelerate more slowly, eventually reaching a maximum speed called the terminal velocity.
2e) Design an experiment to measure the drag coefficient of an A4 piece of paper, which uses only the materials allowed in this exam (non-programmable calculator, pens, pencils, erasers, ruler), a tape measure and a stopwatch. Your answer should include (i) an explanation of the method in detail, (ii) any assumptions you made, (iii) how you would analyse your data to find the drag coefficient, and (iv) any significant sources of uncertainty and how you would mitigate them.
Risposta: a) ; b) ; c) ; d) (intercept )
Soluzione:
2a) The ratio of the side lengths is and the total area is , so the shorter side is and the longer side is .
2b) .
2c) To find the volume we need the thickness; the best way to measure it is to take an average over many sheets of paper. With 14 sheets of regular printer paper (80 gsm) the thickness is , giving a density of . Because the mass may not be accurate, any reasonable values were accepted.
2d) Let be the distance up the ramp, the distance travelled along flat ground, the angle of the ramp to the ground, the coefficient of kinetic friction and the initial height. By conservation of energy Linearising, The table should include columns for and with appropriate units and significant figures:
| (°) | 35 | 40 | 45 | 50 | 55 | 60 | 65 | 70 | 75 | 80 |
|---|---|---|---|---|---|---|---|---|---|---|
| (cm) | 6 | 23 | 47 | 61 | 75 | 94 | 120 | 129 | 142 | 162 |
| 0.70 | 0.84 | 1.00 | 1.19 | 1.43 | 1.73 | 2.14 | 2.75 | 3.73 | 5.67 | |
| (m) | 0.07 | 0.30 | 0.66 | 0.95 | 1.31 | 1.88 | 2.84 | 3.77 | 5.49 | 9.33 |
The graph should include title, scale, axes, units, plotted points and line of best fit (no uncertainties required). The gradient should be determined using points far apart on the trendline. The -intercept should be to within , and the final value for the coefficient of kinetic friction should be to within . The answer should include a brief comment on reliability and validity, such as invalid assumptions (ignoring energy lost when hitting the ground) or poor reliability due to lack of repetition.
2e) A good method should include: a well-explained method (when to start or stop the stopwatch, tape measure to measure a specific height); dropping a piece of paper from different heights and timing how long it takes to reach the ground, or a similar graphical method; an action to ensure that the paper drops straight down, not side-to-side.
Relevant assumptions include, for example: the paper reaches terminal velocity almost immediately; the paper remains flat and perpendicular to the ground; wind is negligible; forces are vertical; no other forces except gravity and drag; the paper moves in a straight path.
The drag coefficient is found by equating where is the terminal velocity. Plotting against gives a linear graph with gradient , from which the drag coefficient can be extracted.
Significant sources of uncertainty include wind (fans, air conditioner), stopwatch reaction time and fluttering.
Official answers (Australian Science Innovations, 2025 ASO Physics Exam with Answers), from the official PDF. © Australian Science Innovations.
Topic: Newtonian Mechanics, Fluid Mechanics Metodi: Energy Conservation Method, Graph Linearization, Experimental Data Analysis, Order-of-Magnitude Estimation Competenze: Experimental Data Analysis, Graph Linearization, Measurement & Instrumentation, Estimation & Approximation, Significant Figures Objects: Inclined Plane, Block Fonte: Testo (PDF) — p.7 · Soluzione ufficiale (PDF) — p.7
Esperimenti con la carta
Questo fascicolo d’esame è (si spera) fatto di carta A4. La comune carta da ufficio ha una grammatura di 80 grammi per metro quadrato. Un foglio A4 ha dimensioni stabilite e fa parte della serie A, che comprende anche i formati A3 e A5. Questi formati sono definiti dalla norma ISO 216. La serie A ha alcune proprietà curiose:
- tutti i formati della serie hanno lo stesso rapporto tra lato lungo e lato corto;
- unendo due fogli dello stesso formato lungo il lato lungo si ottiene il formato successivo della serie; per esempio, due fogli A4 uniti lungo il lato lungo danno un foglio A3;
- il formato A0 ha un’area di esattamente 1 metro quadrato.
2a) Calcola lunghezza e larghezza di un foglio A4 con 4 cifre significative.
2b) La massa di un tipico foglio A4 è . Qual è l’esponente intero ?
2c) Stima la densità della carta di questo fascicolo. Spiega brevemente metodo e calcoli e stima l’incertezza della misura.
Quando due superfici a contatto scorrono l’una sull’altra subiscono una forza d’attrito che si oppone al moto. Il modulo della forza d’attrito tra due superfici che strisciano è dove è la forza normale tra le due superfici e è il coefficiente di attrito dinamico, una misura della «ruvidità» tra le due superfici.
2d) Austin ha progettato un esperimento per misurare il coefficiente di attrito dinamico tra carta e carta, con il metodo seguente.
- Prende un’asse di legno con la faccia superiore ricoperta di carta e la appoggia al muro con una certa inclinazione rispetto al pavimento.
- Stende della carta sul pavimento dopo la rampa.
- Avvolge una massa di nella carta e la lascia scivolare da ferma partendo dalla cima dell’asse.
- Misura la distanza tra la fine della rampa e la posizione finale della massa.
- Ripete per diversi angoli della rampa.
I dati raccolti da Austin sono nella tabella seguente; purtroppo non ha avuto il tempo di completarne l’analisi. Completa la tabella e traccia un grafico opportuno per determinare il coefficiente d’attrito. Commenta brevemente la validità del risultato. Se riesci, determina anche la lunghezza della rampa usata.
Suggerimento: ricava un’equazione che leghi e (e altre costanti) e linearizzala nella forma , dove e dipendono da e , mentre e sono costanti.
| (°) | 35 | 40 | 45 | 50 | 55 | 60 | 65 | 70 | 75 | 80 |
|---|---|---|---|---|---|---|---|---|---|---|
| (cm) | 6 | 23 | 47 | 61 | 75 | 94 | 120 | 129 | 142 | 162 |
Un oggetto, come un foglio A4, che si muove in un fluido come l’aria subisce una forza di resistenza opposta al moto, di modulo dove è la densità del fluido, è l’area della superficie dell’oggetto perpendicolare al moto, è la velocità dell’oggetto e è il coefficiente di resistenza adimensionale, che dipende dal materiale e dalla geometria. Un oggetto soggetto a una resistenza significativa accelera più lentamente e raggiunge infine una velocità massima, detta velocità limite.
2e) Progetta un esperimento per misurare il coefficiente di resistenza di un foglio A4 usando solo i materiali ammessi in questa prova (calcolatrice non programmabile, penne, matite, gomme, righello), un metro a nastro e un cronometro. La risposta deve comprendere (i) una descrizione dettagliata del metodo, (ii) le ipotesi fatte, (iii) come analizzeresti i dati per ricavare il coefficiente di resistenza e (iv) le principali fonti di incertezza e come ridurle.
Risposta: a) ; b) ; c) ; d) (intercetta )
Soluzione: La soluzione ufficiale completa (in inglese) è nella versione originale di questo quesito e nel PDF ufficiale.
Topic: Newtonian Mechanics, Fluid Mechanics Metodi: Energy Conservation Method, Graph Linearization, Experimental Data Analysis, Order-of-Magnitude Estimation Competenze: Experimental Data Analysis, Graph Linearization, Measurement & Instrumentation, Estimation & Approximation, Significant Figures Objects: Inclined Plane, Block Fonte: Testo (PDF) — p.7 · Soluzione ufficiale (PDF) — p.7
Fun with Friction
Friction forces oppose the relative motion between two surfaces in contact. The maximum force due to friction depends on the normal force between the two surfaces (i.e. how strongly they are pressed together) and also the coefficient of friction (which depends on what the surfaces are made of). The maximum force due to friction is given by
A cylinder of height and radius is placed upright on a ramp that is inclined at angle to the horizontal. This means that the circular face of the cylinder is against the ramp. The cylinder is of uniform density and has mass . The coefficient of friction between the cylinder and the ramp is .
3a) Draw a free body diagram of the cylinder (that is, a diagram showing all of the forces acting on the cylinder).
3b) Stephen slowly tilts the ramp to increase its steepness. As the angle increases, eventually the cylinder will tip over. What is the angle of the ramp when the cylinder begins to tip over? Assume that the coefficient of friction between the ramp and cylinder is large, so that the cylinder does not slide on the ramp.
Next we will consider what happens if the coefficient of friction is lower, so that the cylinder slides down the ramp instead of tipping.
3c) The cylinder begins at a distance from the bottom of the ramp. Find an equation for the amount of time, , that it takes for the cylinder to slide to the bottom of the ramp.
3d) Find a numerical value for (in seconds) for the case where , , , , and . Write your answer to three significant figures.
Now consider a ramp made from two different materials. The left side of the ramp has friction coefficient and the right side of the ramp has friction coefficient . The boundary between the two halves of the ramp is perfectly straight and in the centre of the ramp. The cylinder is initially placed in the centre of the ramp, so the centre of mass is over the boundary between the two surfaces and half of the cylinder is on each side. Then, it is released and begins to slide down the ramp.
3e) Suppose that . As the cylinder slides down the ramp, does its centre of mass move towards the left side of the ramp, the right side of the ramp, or remain in the centre? Explain your thinking using words (and diagrams if you wish).
Risposta: b) ; c) ; d) ; e) thin-disk model: stays on the centre line; tall cylinder: moves left (lower friction side)
Soluzione:
3a) All three forces in the correct directions: gravitational force (the largest) straight down; normal force at to the slope; friction force (the smallest) up the slope.
3b) The problem can be approached geometrically by finding the angle at which the centre of mass is directly above the edge of the cylinder: Alternatively, when the cylinder is about to tip over the normal force from the ramp must act at the lower edge of the cylinder; set the sum of torques about any point on the cylinder to zero.
3c) Sum of forces parallel to the ramp surface: . From kinematics , so . Therefore
3d) .
3e) Two distinct cases can be considered; full marks are given for either explanation if it is correct.
Case 1 – thin disk approximation (the pressure on each part of the disk is even). The friction force always opposes the relative motion of the surfaces. Since the friction on one side of the cylinder is greater, there is a net torque on the cylinder from the ramp and so it begins to rotate. Adding the friction forces on every point of the contact surface, the left–right components on each (left–right) half of the cylinder cancel out (the top always cancels out the bottom half). So the net friction force is directed up the ramp (not side-to-side) and the centre of mass remains on the centre line between the two sides.
Case 2 – tall cylinder regime (students must explicitly state that the pressure on the front of the cylinder is higher than on the back). The object still rotates, but now the forces on the front (bottom) half of the cylinder do not cancel those on the back (top) half. Viewed from above, the cylinder rotates anticlockwise; therefore it experiences a net force to the left and moves towards the left (lower friction) side.
Official answers (Australian Science Innovations, 2025 ASO Physics Exam with Answers), from the official PDF. © Australian Science Innovations.
Topic: Newtonian Mechanics, Rigid Body Statics Metodi: Free-Body Diagram, Kinematic Equations, Torque & Angular Momentum Analysis, Symmetry Argument Competenze: Diagrammatic Reasoning, Physical Reasoning, Mathematical Modeling, Significant Figures Objects: Cylinder, Inclined Plane Fonte: Testo (PDF) — p.12 · Soluzione ufficiale (PDF) — p.12
Divertirsi con l’attrito
Le forze d’attrito si oppongono al moto relativo tra due superfici a contatto. La forza d’attrito massima dipende dalla forza normale tra le due superfici (cioè da quanto sono premute l’una contro l’altra) e dal coefficiente d’attrito (che dipende dai materiali delle superfici). La forza d’attrito massima è
Un cilindro di altezza e raggio è appoggiato in piedi su una rampa inclinata di un angolo rispetto all’orizzontale, cioè con una base circolare a contatto con la rampa. Il cilindro ha densità uniforme e massa . Il coefficiente d’attrito tra cilindro e rampa è .
3a) Disegna il diagramma di corpo libero del cilindro (cioè un diagramma con tutte le forze che agiscono sul cilindro).
3b) Stephen inclina lentamente la rampa aumentandone la pendenza. Al crescere di il cilindro prima o poi si ribalta. Qual è l’angolo della rampa quando il cilindro comincia a ribaltarsi? Supponi che il coefficiente d’attrito tra rampa e cilindro sia grande, così che il cilindro non scivoli sulla rampa.
Consideriamo ora che cosa succede se il coefficiente d’attrito è più piccolo, così che il cilindro scivola lungo la rampa invece di ribaltarsi.
3c) Il cilindro parte a distanza dal fondo della rampa. Trova un’espressione per il tempo che impiega a scivolare fino al fondo della rampa.
3d) Trova il valore numerico di (in secondi) nel caso , , , , e . Scrivi la risposta con tre cifre significative.
Considera ora una rampa fatta di due materiali diversi: la metà sinistra ha coefficiente d’attrito e la metà destra . Il confine tra le due metà è perfettamente rettilineo e passa per il centro della rampa. Il cilindro è posto inizialmente al centro della rampa, con il centro di massa sopra il confine tra le due superfici e metà cilindro su ciascun lato; poi viene lasciato libero e comincia a scivolare.
3e) Supponi . Mentre il cilindro scivola lungo la rampa, il suo centro di massa si sposta verso il lato sinistro, verso il lato destro o resta al centro? Spiega il ragionamento a parole (ed eventualmente con diagrammi).
Risposta: b) ; c) ; d) ; e) modello a disco sottile: resta sulla linea centrale; cilindro alto: si sposta a sinistra (lato con meno attrito)
Soluzione: La soluzione ufficiale completa (in inglese) è nella versione originale di questo quesito e nel PDF ufficiale.
Topic: Newtonian Mechanics, Rigid Body Statics Metodi: Free-Body Diagram, Kinematic Equations, Torque & Angular Momentum Analysis, Symmetry Argument Competenze: Diagrammatic Reasoning, Physical Reasoning, Mathematical Modeling, Significant Figures Objects: Cylinder, Inclined Plane Fonte: Testo (PDF) — p.12 · Soluzione ufficiale (PDF) — p.12
Introduction to Curved Spacetime
When a physical situation has spherical symmetry, it becomes more convenient to use a spherical polar coordinate system instead of a normal cartesian coordinate system. The diagram below illustrates a polar coordinate system where any point in 3D space can be represented by three coordinates:
- a distance from the origin ();
- an angle from the north pole (), called the polar angle;
- a longitude angle moving towards the -axis from the -axis (), called the azimuthal angle.
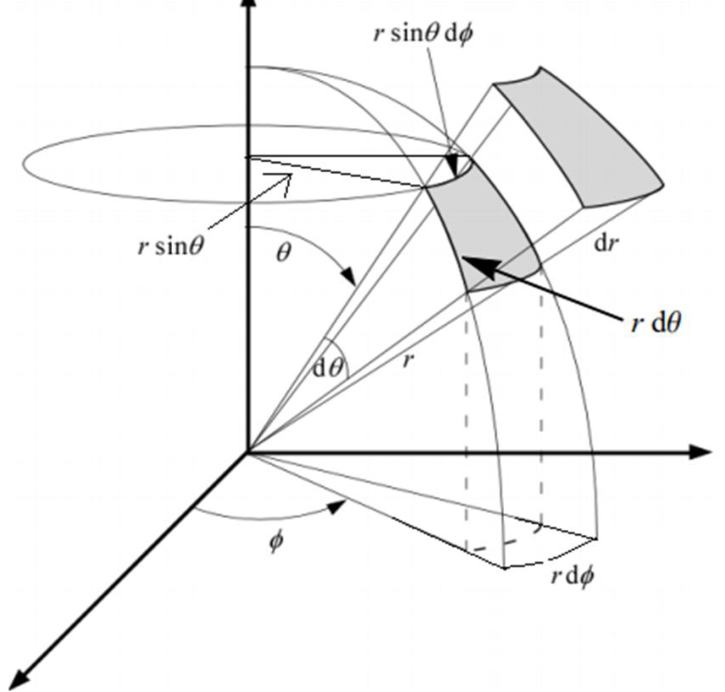
Note, the angular coordinates are given in radians. Also note that in this question is not a variable, it refers to an infinitesimal (tiny) change in a variable. So in the diagram above, means a tiny change in radius and and mean tiny changes in angle.
4a) Consider two different objects. Object 1 is originally at the coordinate . Object 2 has the coordinates , where . Imagine that both objects are rotated around the vertical axis by the same angle. This results in a small change in . Which object travels further? Justify your answer.
In physics, the term metric refers to a formula that defines how distances are measured. In cartesian coordinates the metric is given by Pythagoras’s theorem: where is the distance between two points and , and are the differences in the , and coordinates respectively. When using spherical polar coordinates the metric is given by Note that this formula is only accurate for small changes in coordinates , and .
4b) Suppose that and are kept constant ( and ). In this circumstance how does depend on , and ? Explore what the equation predicts and explain whether the behaviour makes sense or not.
The theory of relativity proposed by Einstein between 1905 and 1915 states that time and space are not separate but should be considered together as a four-dimensional spacetime. The spacetime around a non-rotating mass can be described by the Schwarzschild metric. In this case, the spacetime interval (the spacetime equivalent of distance) between two nearby events (events have a time coordinate as well as position coordinates) is where is the spacetime interval between two events and is a small time interval between the two events as observed by someone far away from the mass. and are defined as in spherical polar coordinates. However, the coordinate is now defined differently because it may not be possible to walk radially out from a heavy mass: we construct a giant spherical frame around the mass, and define the coordinate for any point on the frame as the circumference of the frame divided by . is the gravitational constant, is the mass of the heavy object and is the speed of light.
4c) At what points do singularities (both coordinate and physical) occur in the spacetime coordinate system defined by equation 3?
Imagine that we created two spherical frames: frame 1 has radius and frame 2 has radius , where . Imagine you are on the inside of frame 1 and extend a tape measure directly towards the centre of the frame until it touches frame 2. In everyday life, you would expect to measure a distance of .
4d) If frames 1 and 2 were built around a very large mass, would you actually measure as the distance between the frames, or would you measure a different distance? Explain what you would measure and justify your answer.
We now define , such that frame 1 always has an -coordinate slightly greater than frame 2. We now use a (perfectly rigid) tape measure to measure the distance between the two frames. If you set , and , this distance is given by
4e) Plot a graph of against . Label any singularities on your diagram.
When two events occur at the same position, the proper time between the events is defined as the time that passed for an observer who was present at both events and is given by . This time may not be the same as the time observed by someone far away, who would measure the coordinate time .
4f) Imagine you are at a safe distance () and you have a strobe light which is falling and getting close to a heavy mass in the centre of the frame. The light is programmed to flash once per second. Describe what you would see watching this light if you remain at the safe distance. Justify your answer.
4g) How would this compare with your observations if you were to fall with the strobe light towards the centre?
Risposta: a) object 2; c) , , , , , ; d) a distance larger than ; f) flashes become less and less frequent; g) once per second
Soluzione:
4a) The further away you are from the origin, the more distance is swept out for the same angle. Therefore, as , object 2 travels a larger distance.
4b) As gets larger, gets larger. If the distance travelled is for any change in . Similarly, if (at or , the north and south poles) the distance travelled is regardless of the change in . For a given , increases as increases up to a maximum at and then decreases again. is meant to be a small change; for large the maximum would occur at and the distance would go to zero as and .
At the North Pole, can change even though nothing moves. That is not a problem with the place, it is a problem with the coordinates: a coordinate singularity. The maths looks weird, but space itself is normal. This is different from a physical singularity, where spacetime itself breaks down.
4c) , , , , and .
4d) You would measure a distance larger than , because of the factor , which is strictly greater than 1, multiplying . No integration of the term is expected; only a qualitative explanation is required.
4e)
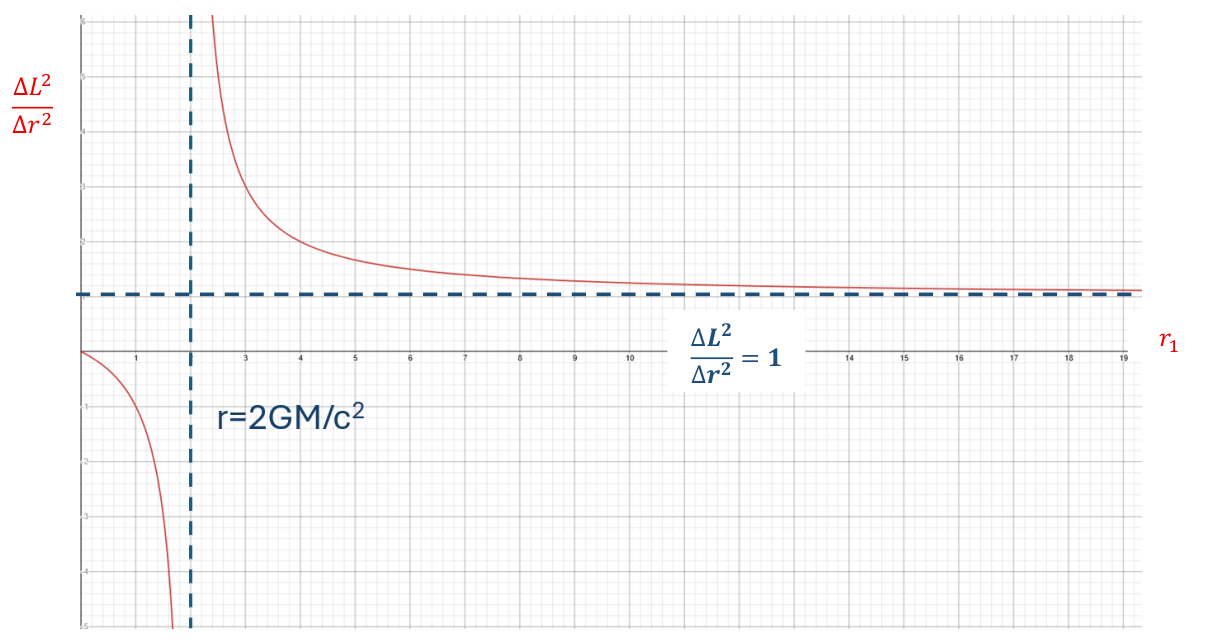
The curve diverges at and tends to the asymptote for large .
4f) An external observer sees the flashes becoming less and less frequent: because of the scale factor on the time coordinate, one must wait longer and longer before the same spacetime interval occurs between consecutive flashes. (Some students considered the Doppler effect; this also gives the correct answer.)
4g) If you fall with the strobe light, you observe the flashes occurring at a constant rate of once per second.
A coordinate singularity occurs at the Schwarzschild radius, the point of no return around a black hole: at this boundary nothing can escape outward, not even light. The coordinates used in the standard black hole solution become confusing there but, just like at the North Pole, that does not mean the place itself is broken.
Official answers (Australian Science Innovations, 2025 ASO Physics Exam with Answers), from the official PDF. © Australian Science Innovations.
Topic: Gravitation, Special Relativity, Mathematics Metodi: Physical Modeling, Approximation & Series Expansion, Symmetry Argument Competenze: Mathematical Modeling, Physical Reasoning, Diagrammatic Reasoning Objects: Black Hole Fonte: Testo (PDF) — p.16 · Soluzione ufficiale (PDF) — p.16
Introduzione allo spaziotempo curvo
Quando una situazione fisica ha simmetria sferica conviene usare un sistema di coordinate polari sferiche invece delle normali coordinate cartesiane . Il diagramma seguente illustra un sistema di coordinate polari, in cui ogni punto dello spazio 3D è rappresentato da tre coordinate:
- la distanza dall’origine ();
- l’angolo dal polo nord (), detto angolo polare;
- l’angolo di longitudine, misurato dall’asse verso l’asse (), detto angolo azimutale.
Le coordinate angolari sono espresse in radianti. In questo quesito non è una variabile, ma indica una variazione infinitesima (piccolissima) di una variabile: nel diagramma è una piccolissima variazione del raggio e , sono piccolissime variazioni degli angoli.
4a) Considera due oggetti. L’oggetto 1 si trova inizialmente nel punto di coordinate , l’oggetto 2 in , con . Immagina di ruotare entrambi gli oggetti dello stesso angolo attorno all’asse verticale, con una piccola variazione di . Quale oggetto percorre la distanza maggiore? Giustifica la risposta.
In fisica il termine metrica indica la formula che definisce come si misurano le distanze. In coordinate cartesiane la metrica è data dal teorema di Pitagora: dove è la distanza tra due punti e , , sono le differenze delle coordinate , e . In coordinate polari sferiche la metrica è Questa formula vale solo per piccole variazioni delle coordinate , e .
4b) Supponi che e restino costanti ( e ). In questo caso, come dipende da , e ? Esplora che cosa prevede l’equazione e spiega se il comportamento ha senso oppure no.
La teoria della relatività, proposta da Einstein tra il 1905 e il 1915, afferma che tempo e spazio non sono separati ma vanno considerati insieme come uno spaziotempo quadridimensionale. Lo spaziotempo attorno a una massa non rotante è descritto dalla metrica di Schwarzschild. In questo caso l’intervallo spaziotemporale (l’equivalente spaziotemporale della distanza) tra due eventi vicini (gli eventi hanno una coordinata temporale oltre a quelle spaziali) è dove è l’intervallo spaziotemporale tra i due eventi e è un piccolo intervallo di tempo tra i due eventi misurato da un osservatore lontano dalla massa. e sono definiti come nelle coordinate polari sferiche. La coordinata invece è definita diversamente, perché potrebbe non essere possibile allontanarsi radialmente da una grande massa: si costruisce un’enorme struttura sferica attorno alla massa e si definisce la coordinata di ogni punto della struttura come la circonferenza della struttura divisa per . è la costante gravitazionale, la massa del corpo e la velocità della luce.
4c) In quali punti si hanno singolarità (sia di coordinate sia fisiche) nel sistema di coordinate spaziotemporali definito dall’equazione 3?
Immagina di costruire due strutture sferiche: la struttura 1 ha raggio e la struttura 2 ha raggio , con . Immagina di trovarti all’interno della struttura 1 e di stendere un metro a nastro dritto verso il centro fino a toccare la struttura 2. Nella vita di tutti i giorni ti aspetteresti di misurare una distanza .
4d) Se le strutture 1 e 2 fossero costruite attorno a una massa molto grande, misureresti davvero come distanza tra le strutture, o una distanza diversa? Spiega che cosa misureresti e giustifica la risposta.
Definiamo ora , così che la struttura 1 abbia sempre una coordinata di poco maggiore della struttura 2, e usiamo un metro a nastro (perfettamente rigido) per misurare la distanza tra le due strutture. Ponendo , e , questa distanza è
4e) Traccia il grafico di in funzione di , indicando sul diagramma le eventuali singolarità.
Quando due eventi avvengono nella stessa posizione, il tempo proprio tra i due eventi è il tempo trascorso per un osservatore presente a entrambi gli eventi ed è dato da . Questo tempo può non coincidere con quello osservato da qualcuno lontano, che misurerebbe il tempo coordinato .
4f) Immagina di trovarti a distanza di sicurezza () e di avere una luce stroboscopica che cade avvicinandosi a una grande massa al centro della struttura. La luce è programmata per lampeggiare una volta al secondo. Descrivi che cosa vedresti osservando la luce restando a distanza di sicurezza. Giustifica la risposta.
4g) Come cambierebbero le tue osservazioni se cadessi verso il centro insieme alla luce stroboscopica?
Risposta: a) l’oggetto 2; c) , , , , , ; d) una distanza maggiore di ; f) lampi sempre più radi; g) un lampo al secondo
Soluzione: La soluzione ufficiale completa (in inglese) è nella versione originale di questo quesito e nel PDF ufficiale.
Topic: Gravitation, Special Relativity, Mathematics Metodi: Physical Modeling, Approximation & Series Expansion, Symmetry Argument Competenze: Mathematical Modeling, Physical Reasoning, Diagrammatic Reasoning Objects: Black Hole Fonte: Testo (PDF) — p.16 · Soluzione ufficiale (PDF) — p.16
Answers from the official ASI marking answers (2025 ASO Physics Exam with Answers). Open-ended parts (1e, 2e, 3a, 4b, 4e) are described in the solutions.
| Problem | Title | Risposta |
|---|---|---|
| 1 | Sliding Snails | a) friction; b) the interwave regions; c), d) –; f) false; g) false |
| 2 | Practicals with Paper | a) ; b) ; c) ; d) (intercept ) |
| 3 | Fun with Friction | b) ; c) ; d) ; e) thin-disk model: stays on the centre line; tall cylinder: moves left (lower friction side) |
| 4 | Introduction to Curved Spacetime | a) object 2; c) , , , , , ; d) a distance larger than ; f) flashes become less and less frequent; g) once per second |
Fonte: Testo e soluzioni (PDF)
Risposte tratte dalle soluzioni ufficiali ASI (2025 ASO Physics Exam with Answers). I punti a risposta aperta (1e, 2e, 3a, 4b, 4e) sono descritti nelle soluzioni.
| Problema | Titolo | Risposta |
|---|---|---|
| 1 | Lumache che scivolano | a) l’attrito; b) le regioni d’interonda; c), d) –; f) falsa; g) falsa |
| 2 | Esperimenti con la carta | a) ; b) ; c) ; d) (intercetta ) |
| 3 | Divertirsi con l’attrito | b) ; c) ; d) ; e) modello a disco sottile: resta sulla linea centrale; cilindro alto: si sposta a sinistra (lato con meno attrito) |
| 4 | Introduzione allo spaziotempo curvo | a) l’oggetto 2; c) , , , , , ; d) una distanza maggiore di ; f) lampi sempre più radi; g) un lampo al secondo |
Fonte: Testo e soluzioni (PDF)