Q1
1a This question is about surface tension. You are unlikely to have studied it in depth, if at all; however sufficient help is given to enable you to solve the problems.
(i)
Figure 1a1
The surface tension is the force per unit length in the surface of a liquid when the liquid is in contact with a solid perpendicular to the line of contact of the surface with the solid. An example is given in Figure 1a1 where a clean glass microscope slide is hung on a balance and lowered into clean water such that the water just touches the base of the slide. The water wets the glass and the surface of the water adjusts so that it climbs and makes a very small angle () with the surface of the glass. This angle is named the angle of contact and is practically zero for clean water and clean glass. There is tension between the molecules of water and it is that tension that pulls down the glass slide. The length of the slide “into the paper” is giving the total perimeter approximately . Show that
where is the weight of the slide after immersion and is the weight of the slide before immersion.
Figure1a2
Figure1a2 shows a small water droplet, radius . The dark blue is the circular water surface if the droplet is cut in half. The perimeter of the blue circle is the line along which the tension acts, illustrated by the orange arrows. By considering the stability of one hemisphere, or otherwise, show that:
(Equation 1a2)
where is the excess pressure in the droplet above the surroundings.
1b Figure 1b1
Bubble formation caused by sound waves.
The phenomenon of cavitation is caused by low pressure. This a very difficult problem affecting a ship’s propellers, pumps etc. Parts of the liquid reach a lower pressure causing the liquid to superheat locally and cause bubbles to form. These grow and then may suffer catastrophic collapse. The temperature in a collapsing bubble may reach values greater than K. Some have speculated that this might be used to initiate fusion. Sound waves may initiate the formation of bubbles and light may be emitted during their collapse, Figure 1b1. Equation 1a2 shows that the pressure in a very small bubble will be high so that a higher water temperature than normal boiling point may be needed to initiate the bubble formation. A charged bubble will reduce the temperature needed to start the bubble. This is used to show the tracks of charged particles through hydrogen liquid bubble chambers.
Figure 1b3 shows a cross section of two large metal plates with a charge of and . The area of a plate is . Ignoring edge effects show that the force of attraction between the plates is given by:
(Hint. The theorem of Gauss states that if a surface , is found such that the lines of electric field pierce that surface at right angles to the surface then for a simple symmetrical case,
where is the electric field, is a constant, is the charge enclosed by the surface and is the surface area of the surface that surrounds the charge. Any surface that encloses a charge in this way is called a Gaussian surface. Figure 1b2 shows a spherical Gaussian surface around a small isolated charge . The purple line in Figure 1b3 shows the Gaussian surface enclosing the charge . Consider the force on an elemental charge due to the E field it is in.)
Hence or otherwise find the outward pressure on an isolated spherical water drop with a charge , radius . Find the outward pressure due to the electrostatic effect on a bubble in water with a radius of whose charge is caused by excess electrons. How does this compare with normal atmospheric pressure? Gaussian surface surrounding isolated charge . Figure 1b2 Lines of E field. Figure 1b3 Gaussian surface A
-+ + + + + + + + + + + + + +
Elemental charge
1c Figure 1c1 x y r Proton
Electron
A proton is constrained to move in a circle of radius at an angular velocity of in a non conducting ring, in the plane Figure 1c1. Note that the velocity of light. Consider an electron a large distance away from the centre of the ring, find an expression for the force on the stationary electron. Is the force the same if the electron moves? Explain your answer. Why will a charged particle moving in a circular track in a very good vacuum lose energy?
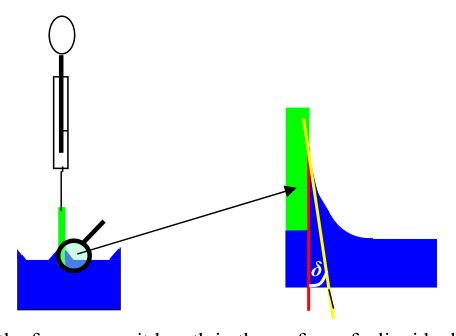 lastra di vetro in acqua, tensione superficiale
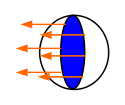 gocciolina d’acqua sezione circolare con frecce tensione
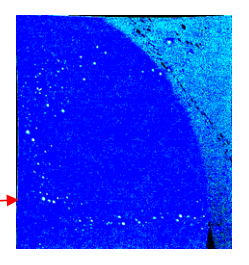 formazione bolle per onde sonore
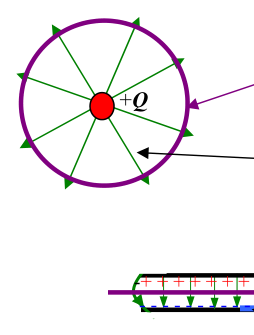 superficie gaussiana sferica attorno a carica Q
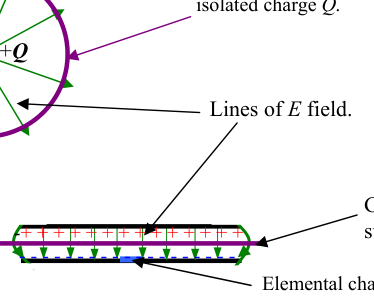 armature parallele con superficie gaussiana e cariche
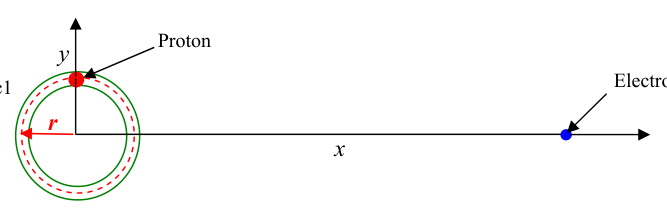 protone in orbita circolare, elettrone lontano
Topic: Fluid Mechanics, Electrostatics, Electromagnetism Metodi: Free-Body Diagram, Gauss’s Law, Coulomb’s Law Competenze: Physical Reasoning, Mathematical Modeling, Diagrammatic Reasoning Objects: Droplet, Bubble, Capacitor, Electron Fonte: Testo (PDF) — p.2
Q1
1a Questa domanda riguarda la tensione superficiale. È improbabile che tu l’abbia studiato in profondità, se non per niente; sebbene sia fornito un aiuto sufficiente per risolvere i problemi.
(i)
Figura 1a1
La tensione superficiale è la forza per unità di lunghezza nella superficie di un liquido quando il liquido è in contatto con un solido perpendicolare alla linea di contatto della superficie con il solido. Un esempio è indicato nella figura 1a1 dove un microscopio di vetro pulito viene appeso su un equilibrio e abbassato in acqua pulita tale che l’acqua tocchi solo la base della glissiera. L’acqua bagna il bicchiere e il La superficie dell’acqua si regola in modo che si arrampicino e si formino un angolo molto piccolo () con la superficie di Il vetro. Questo angolo è chiamato angolo di contatto ed è praticamente zero per l’acqua pulita e vetro pulito. C’è tensione tra le molecole d’acqua ed è questa tensione che si abbassa la diapositiva in vetro. La lunghezza della diapositiva in carta è dando il perimetro totale circa . Mostrami questo.
dove è il peso della diapositiva dopo l’immersione e è il peso della diapositiva prima della immersione Immersione.
Figura 1a2
La figura 1a2 mostra una piccola goccia d’acqua, di raggio . Il blu scuro è la superficie circolare dell’acqua se la la goccia è tagliata a metà. Il perimetro del cerchio blu è la linea lungo la quale agisce la tensione, illustrato dalle frecce arancione. Considerando la stabilità di un emisfero, o altrimenti, dimostrare che:
(Equazione 1a2)
dove è la pressione in eccesso nella goccia sopra l’ambiente circostante.
1b Figura 1b1
Formazione di bolle causata con le onde sonore.
Il fenomeno della cavitazione è causato da bassa pressione. Questo è un problema molto difficile che riguarda Propeller, pompe, ecc. di una nave Alcune parti del liquido raggiungono una pressione inferiore, causando la supercaldo a livello locale e causano la formazione di bolle. Queste crescono e poi possono subire catastrofi collasso. La temperatura in una bolla in collasso può raggiungere valori superiori a K. Alcuni hanno Spiegato che questo potrebbe essere usato per avviare la fusione. Le onde sonore possono iniziare la formazione di le bolle e la luce possono essere emesse durante il loro crollo, figura 1b1. L’equazione 1a2 mostra che il la pressione in una bolla molto piccola sarà elevata in modo che una temperatura dell’acqua superiore alla normale ebollizione può essere necessario un punto per avviare la formazione della bolla. Una bolla carica ridurrà il temperatura necessaria per avviare la bolla. Questo è usato per mostrare le tracce di particelle cariche attraverso le camere di bolle liquide di idrogeno.
La figura 1b3 mostra una sezione trasversale di due grandi lastre di metallo con una carica di e . La zona di una piastra è . Ignorando gli effetti di bordo, si dimostra che la forza di attrazione tra le piastre è data by:
- Un suggerimento. Il teorema di Gauss afferma che se una superficie , è trovata tale che le linee di campo elettrico perforano la superficie a angolo retto verso la superficie, quindi per un semplice caso simmetrico,
se è il campo elettrico, è una costante, è la carica circondata dalla superficie e è la superficie area della superficie che circonda la carica. Qualsiasi superficie che circonda una carica in questo modo è chiamata una Superficie gaussiana. La figura 1b2 mostra una superficie di Gaussian sferica attorno a una piccola carica isolata . La linea viola della figura 1b3 mostra la superficie di Gaussian che racchiude la carica . Considerate la forza su un carica elementare a causa del campo E in cui si trova.)
In tal modo o in altro modo, si trova la pressione esterna su una goccia di acqua sferica isolata con carica , radius . Trova la pressione esterna dovuta all’ effetto elettrostatico su una bolla in acqua con un radius di la cui carica è causata da un eccesso di elettroni . Come si confronta questo con pressione atmosferica normale? Superficie di Gaussian che circonda carica isolata . Figura 1b2 Linee di campo E. Figura 1b3 Gaussian superficie A
-+ + + + + + + + + + + + + +
Carga elementare
1c Figura 1c1 x y r Protone
Electrone
Un protone è costretto a muoversi in un cerchio di raggio a una velocità angolare di in un non Anello di conduttore, nel piano Figura 1c1. Nota che è la velocità della luce. Considerate un L’elettrone a una grande distanza dal centro dell’anello, trova un’espressione della forza sulla elettrone stazionario. La forza è la stessa se l’elettrone si muove? Spiega la tua risposta. Perché una particella carica che si muove in una pista circolare in un buon vuoto perde energia?
lastra di vetro in acqua, tensione superficiale
*gocciolina d’acqua sezione circolare con frequenza di tensione *
formazione bolle per onde sonore
*superficie gaussiana sferica attorno a carica Q *
- armatura parallela con superficie gaussiana e cariche *
protone in orbita circolare, elettrone lontano
Topic: Fluid Mechanics, Electrostatics, Electromagnetism Metodi: Free-Body Diagram, Gauss’s Law, Coulomb’s Law Competenze: Physical Reasoning, Mathematical Modeling, Diagrammatic Reasoning Objects: Droplet, Bubble, Capacitor, Electron Fonte: Testo (PDF) — p.2
Q2
Marker
Figure 2.1a Figure 2.1b
t/s
7.0 7.5 8.0 Initial clap I/arb
a) Figure 2.1b shows a simplified cross section of the Jamie mosque in Isfahan in Iran (venue of the International Olympiad in 2007). On the floor of the mosque there is a metal marker. If one claps one’s hands near the marker it is suggested that multiple echoes should be heard. A digital camera was placed on the marker. Hands were clapped and the sounds recorded by a digital camera in “movie mode”. Figure 2.1a shows a recording of the intensity of the sound. A time scale is shown in Figure 2.1a. There was a discussion amongst the physics leaders as to whether the marker is at the centre of the circular dome (if it is circular in cross section) or at the focus of the dome. N.B the sketch in Figure 2.1b is not to scale or correct proportion.
(i) Is the marker at the focus or the centre of curvature of the dome you can assume is spherical? How is it possible to decide this from the given data? (ii) Use the information given to determine the height of the centre of the interior of the dome. Carefully estimate the errors. (iii) The intensity of sound, , is given by
is the angular frequency, is the max intensity, a constant, and is the time.
It is suggested that the max intensity of the sound at the first reflection is related to that of the second reflection by an equation mathematically similar to that of radioactive decay measured at equal time intervals i.e.
By analysing the diagram Figure 2.1a find evidence to support, or reject, this assertion. Explain why your conclusion should be expected on theoretical grounds.
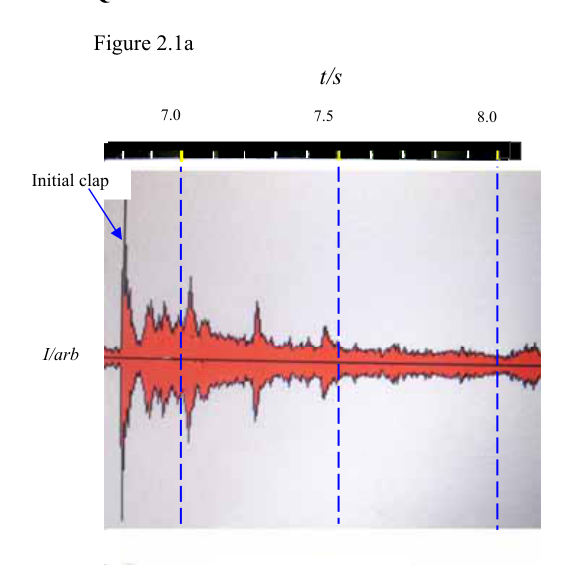 intensità sonora in funzione del tempo
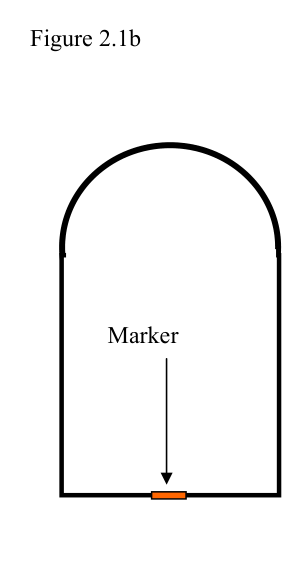 sezione trasversale cupola moschea con marcatore
Topic: Oscillations & Waves, Geometric Optics Metodi: Experimental Data Analysis, Error Propagation, Radioactive Decay Law Competenze: Experimental Data Analysis, Error Propagation, Physical Reasoning Objects: — Fonte: Testo (PDF) — p.5
Q2
Marchio
Figura 2.1a Figura 2.1b
t/s
7.0 7.5 8.0 Applausi iniziali I/arb
a) La figura 2.1b mostra una sezione trasversale semplificata della moschea di Jamie a Isfahan in Iran (luogo di svolgimento della Olimpiada internazionale del 2007). Sul pavimento della moschea c’ è un metallo
- Il marchio. Se si clacca le mani vicino al marcatore si suggerisce che più eco dovrebbero essere
- Ho sentito. Una telecamera digitale è stata posta sul marcatore. Le mani erano applaudite e i suoni registrato da una telecamera digitale in modalità movie. La figura 2.1a mostra una registrazione dell’intensità di Il suono. Una scala temporale è mostrata nella figura 2.1a. C’ è stata una discussione tra i fisici i leader in merito al fatto che il marchio sia al centro della cupola circolare (se è circolare in croce) sezione) o al centro della cupola. N.B. La figura 2.1b non è in scala o corretta proporzione.
(i) Il marchio al centro o al centro di curvatura della cupola si può presumere
- Sferico? Come è possibile decidere questo a partire dai dati dati?
- utilizzare le informazioni fornite per determinare l’altezza del centro dell’interno del
- La cupola. Valutate attentamente gli errori.
- l’intensità sonora, , è data da
è la frequenza angolare, è l’intensità massima, una costante, e è il tempo.
Si suggerisce che l’intensità massima del suono al primo riflesso sia correlata a che della seconda riflessione con un’equazione matematicamente simile a quella di decadimento radioattivo misurato a intervalli di tempo uguali, ovvero
Analizzando il diagramma figura 2.1a, si trovano prove a sostegno o respingono questa affermazione. Spiegate perché si dovrebbe aspettare la vostra conclusione su basi teoriche.
intensità sonora in funzione del tempo
*sezione trasversale cupola moschea con marcatore *
Topic: Oscillations & Waves, Geometric Optics Metodi: Experimental Data Analysis, Error Propagation, Radioactive Decay Law Competenze: Experimental Data Analysis, Error Propagation, Physical Reasoning Objects: — Fonte: Testo (PDF) — p.5
Q3
I Figure 3.1
a) The charge on a capacitor, , of capacity, , is related to its pd, , by the formula . In the circuit Figure 3.1 at time
is the maximum value of and is the angular frequency of the applied ac. Show that the current in the wires is given by
Find an expression for in terms of and .
b) The magnitude of the impedance of the capacitor is defined as .
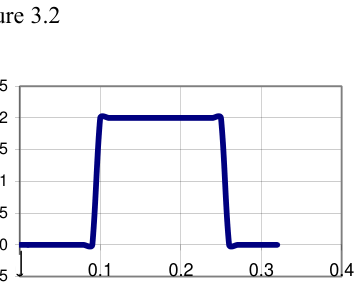
Square Pulse -0.5 0 0.5 1 1.5 2 2.5 0 0.1 0.2 0.3 0.4 t/ms V/ V
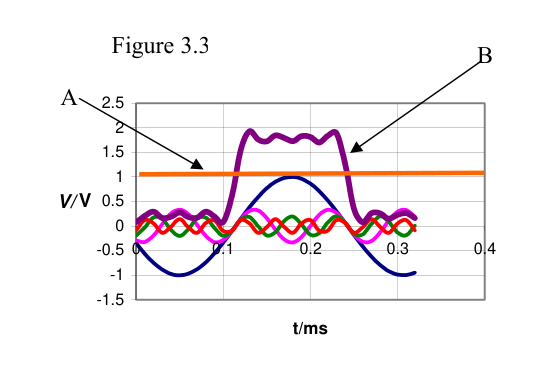
Figure 3.2 shows a periodic square pulse of with a period of . This can be approximated by the addition of four sine waves and a dc of , see A in Figure 3.2. Line B, Figure 3.3, is the plot of
Where is the lowest frequency in Figure 3.3.
Suggest a circuit, to insert into Figure 3.4, giving suggested component value(s) such that the current in the load would be approximately a sine wave. The load has a resistance of .
Fourier Pulse -1.5 -1 -0.5 0 0.5 1 1.5 2 2.5 0 0.1 0.2 0.3 0.4 t/ms V/ V V C Figure 3.3 Figure 3.2 A
Circuit
Load Figure 3.4 Input Pulse length
B Pulse inputs
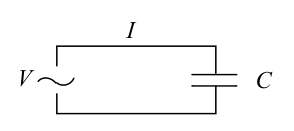 circuito con condensatore e sorgente AC
 impulso quadro periodico 2V
 approssimazione di Fourier dell’impulso quadro
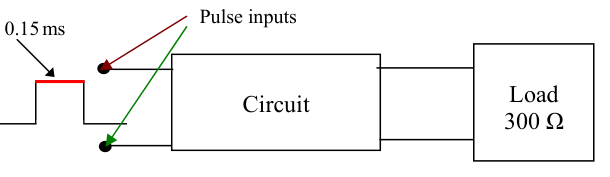 schema filtro circuito con carico 300 ohm
Topic: Circuits, Oscillations & Waves Metodi: Differential Equations, Superposition Principle, Kirchhoff’s Laws Competenze: Mathematical Modeling, Diagrammatic Reasoning, Physical Reasoning Objects: Capacitor, Resistor, Wire Fonte: Testo (PDF) — p.6
Q3
I Figura 3.1
a) La carica di un condensatore, , di capacità, , è correlata al suo pd, , con la formula . In circuito, figura 3.1 al tempo
è il valore massimo di e è la frequenza angolare dell’ac applicato. Mostrare che il corrente nei fili è data da
Trova un’espressione per in termini di e .
b) La magnitudine dell’impedenza del condensatore è definita come .
Pulso quadrato -0.5 0 0.5 1 1.5 2 2.5 0 0.1 0.2 0.3 0.4 t/ms V/ V
La figura 3.2 mostra un impulso quadrato periodico di con un periodo di . Questo può essere approssimato con l’aggiunta di quattro onde sinusoide e di una dc di , cfr. A della figura 3.2. Linea B, La figura 3.3, è la grafica di
Se è la frequenza più bassa nella figura 3.3.
Propone un circuito da inserire nella figura 3.4, con il valore suggerito dei componenti (s) in modo tale che il la corrente nel carico sarebbe approssimativamente un’onda seno. Il carico ha una resistenza di .
Pulso di Fourier -1.5 -1 -0.5 0 0.5 1 1.5 2 2.5 0 0.1 0.2 0.3 0.4 t/ms V/ V V C Figura 3.3 Figura 3.2 A
Circuito
Carga Figura 3.4 Input Lunghezza del polso
B Input di impulso
*circuito con condensatore e sorgente AC *
impulso quadro periodico 2V
*approssimazione di Fourier dell’impulso quadro *
Schema di circuito filtrato con carico 300 ohm
Topic: Circuits, Oscillations & Waves Metodi: Differential Equations, Superposition Principle, Kirchhoff’s Laws Competenze: Mathematical Modeling, Diagrammatic Reasoning, Physical Reasoning Objects: Capacitor, Resistor, Wire Fonte: Testo (PDF) — p.6
Q4
(a) Light from a sodium gas discharge lamp is incident on a gas flame into which common salt crystals are thrown. On a screen behind the flame a dark shadow of the flame is seen. Explain this observation.
(b) In recent years many planets have been spotted orbiting stars. The first ones were spotted by the movement of a star round the common centre of mass of the star-planet system.
(i) Show that when a light source, wavelength , is moving away from an observer at a speed the displacement of the line, , due to orbital motion, will be given by
.
(ii) Find the maximum speed at which the Sun appears to approach the centre of mass of the solar system as viewed from a planet on a distant star. Ignore the effect of all the planets except Jupiter. Then the equation above to determine for a sodium absorption line of wavelength .
(iii) Assume the Sun’s atmosphere is at a temperature of and it is a perfect gas. Find the rms speed of an atom of and an atom of in the Sun’s atmosphere. How do these speeds compare with the speeds found in (ii)? Comment.
c) Another very recent method of detecting planets round other stars is the reduction in light due to the planet passing across the star. Find the fractional reduction in the intensity of light due to the passage of Jupiter across the face of the Sun as seen by a very distant observer at a distance of the order of about . Assume that Jupiter is totally opaque.
d) (i) It is of interest to know whether water is present on these remote planets. The water vapour in the atmosphere of the earth, and possibly the remote planet will absorb certain wavelengths. However in practice we can distinguish between these two effects. How?
(ii) Assume that the atmosphere of the Earth is thick and is sufficiently optically thick to remove all the light from the relevant water vapour spectral lines. Imagine that a very distant observer records the intensity reduction in these water vapour lines due to the passage of the earth across the face of the Sun. Calculate the relative reduction in the intensity of a spectral line due to transit of the atmosphere of the Earth across the line of sight to a distant observer of the Sun who is on a planet orbiting a distant star.
This page is blank
Topic: Astrophysics, Oscillations & Waves, Kinetic Theory Metodi: Kinetic Theory of Gases, Approximation & Series Expansion, Statistical Averaging Competenze: Physical Reasoning, Estimation & Approximation, Mathematical Modeling Objects: Star, Planet, Gas Fonte: Testo (PDF) — p.7
Q4
(a) La luce di una lampada di scarico di gas di sodio incide su una fiamma di gas in cui si inserisce il sale comune I cristalli vengono lanciati. Su uno schermo dietro la fiamma si vede un’ombra scura della fiamma. Spiegate
- Questa osservazione.
(b) Negli ultimi anni sono stati osservati molti pianeti che orbitano attorno alle stelle. I primi furono individuati da il movimento di una stella intorno al centro di massa comune del sistema stellare-planetario.
(i) Mostra che quando una fonte di luce, lunghezza d’onda , si allontana da un osservatore a un punto di velocità il spostamento della linea, , a causa del movimento orbitale, sarà dato da
.
- Trova la velocità massima con cui il Sole sembra avvicinarsi al centro di massa di il sistema solare visto da un pianeta su una stella lontana. Non si deve considerare l’effetto di tutti i pianeti eccetto Giove. Poi l’equazione di cui sopra per determinare per un assorbimento di sodio linea di lunghezza d’onda .
(iii) Supponiamo che l’atmosfera del Sole sia a una temperatura di ed è un gas perfetto. Trova la velocità rms di un atomo di e di un atomo di nell’atmosfera del Sole. Come le velocità di cui al punto ii) sono paragonabili alle velocità di cui al punto ii); Commento.
c) Un altro metodo molto recente per rilevare pianeti attorno ad altre stelle è la riduzione della luce dovuta a al pianeta che attraversa la stella. Trova la riduzione frazionata dell’intensità luminosa dovuta a il passaggio di Giove sulla faccia del Sole visto da un osservatore molto lontano a una distanza di l’ordine di circa . Supponiamo che Giove sia totalmente opaco.
d) (i) È interessante sapere se su questi pianeti remoti è presente acqua. L’acqua la vapore nell’atmosfera terrestre, e forse il pianeta remoto assorbirà alcuni lunghezze d’onda. Tuttavia, in pratica possiamo distinguere tra questi due effetti. - Come? - Come?
(ii) Supponiamo che l’atmosfera terrestre sia spessa e sufficientemente ottica spessore per rimuovere tutta la luce dalle linee spettrali di vapore idrico pertinenti. Immaginate che un L’osservatore molto lontano registra la riduzione di intensità in queste linee di vapore idrico a causa della Passaggio della Terra attraverso la faccia del Sole. Calcolare la riduzione relativa della intensità di una linea spettrale dovuta al transito dell’atmosfera terrestre attraverso la linea di visione per un lontano osservatore del Sole che si trova su un pianeta in orbita intorno a una stella lontana.
Questa pagina è vuota
Topic: Astrophysics, Oscillations & Waves, Kinetic Theory Metodi: Kinetic Theory of Gases, Approximation & Series Expansion, Statistical Averaging Competenze: Physical Reasoning, Estimation & Approximation, Mathematical Modeling Objects: Star, Planet, Gas Fonte: Testo (PDF) — p.7