- Scheda di misurazione e campionamento contenente: (a) Sorgente di tensione costante +9 V e -9 V (per ciascun valore sono disponibili due terminali equivalenti), (b) Due terminali equivalenti di terra, (c) Due terminali equivalenti per il condensatore, (d) Interruttore di selezione del condensatore (può essere impostato su C1 o C2), (e) Voltmetro a bassa corrente di ingresso (nella scheda), (f) Termostato con riscaldatore e sensore di temperatura (nella scheda), (g) Condensatori campione C1 e C2, (h) LED collegato a una sorgente di corrente costante e voltmetro, (i) Pulsante di reset, (j) Porta di alimentazione USB, (k) Porta dati a 6 PIN per il collegamento al tablet.
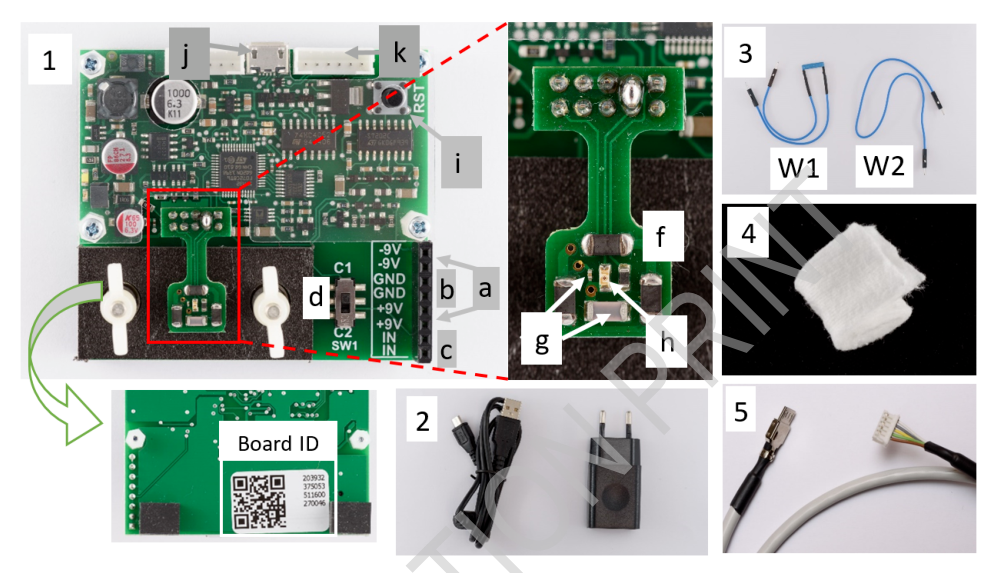 scheda sperimentale con componenti etichettati
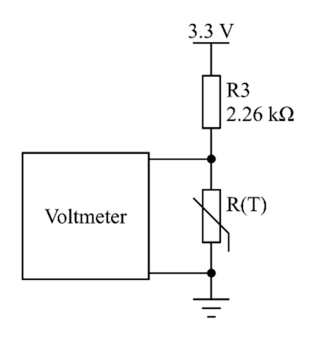 circuito voltmetro con NTC e resistenza
Topic: Electrostatics, Circuits, Thermodynamics Metodi: Physical Modeling, Ideal Gas Law, Kirchhoff’s Laws Competenze: Measurement & Instrumentation, Physical Reasoning, Diagrammatic Reasoning Objects: Capacitor, Resistor Fonte: Testo (PDF) — p.1 Soluzione: Soluzioni (PDF)
- Measurement and sampling sheet containing: (a) Constant voltage source +9 V and -9 V (two terminals are available for each value) equivalent), (b) Two land-equivalent terminals, (c) Two equivalent terminals for the capacitor, (d) Capacitor selection switch (can be set to C1 or C2), (e) Low input current voltmeter (in the board), (f) Thermostat with heater and temperature sensor (in the card), (g) Samples C1 and C2 capacitors, (h) LED connected to a constant current source and voltmeter, (i) Reset pulse, (j) USB power port, (k) It carries 6 PIN data for connection to the tablet.
test sheet with labelled components
voltmeter circuit with NTC and resistance
Topic: Electrostatics, Circuits, Thermodynamics Metodi: Physical Modeling, Ideal Gas Law, Kirchhoff’s Laws Competenze: Measurement & Instrumentation, Physical Reasoning, Diagrammatic Reasoning Objects: Capacitor, Resistor Fonte: Testo (PDF) — p.1 Soluzione: Soluzioni (PDF)
- Alimentazione per la scheda con presa USB Micro-B
Topic: Circuits Metodi: Physical Modeling Competenze: Measurement & Instrumentation, Physical Reasoning Objects: — Fonte: Testo (PDF) — p.1 Soluzione: Soluzioni (PDF)
- Power supply for the USB Micro-B card
Topic: Circuits Metodi: Physical Modeling Competenze: Measurement & Instrumentation, Physical Reasoning Objects: — Fonte: Testo (PDF) — p.1 Soluzione: Soluzioni (PDF)
- Ponticelli – W1 (con resistenza R1 da 100 MΩall’interno) e W2 (0 Ω).
Topic: Circuits Metodi: Kirchhoff’s Laws, Equivalent Circuit Reduction Competenze: Diagrammatic Reasoning, Physical Reasoning Objects: Resistor, Wire Fonte: Testo (PDF) — p.1 Soluzione: Soluzioni (PDF)
- The power output of the system is the same as that of the electrical system.
Topic: Circuits Metodi: Kirchhoff’s Laws, Equivalent Circuit Reduction Competenze: Diagrammatic Reasoning, Physical Reasoning Objects: Resistor, Wire Fonte: Testo (PDF) — p.1 Soluzione: Soluzioni (PDF)
- Materiale termoisolante per il termostato.
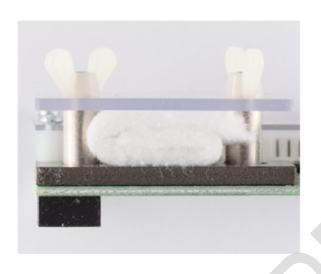 termostato con isolante e piastrina
Topic: Thermodynamics Metodi: Physical Modeling Competenze: Measurement & Instrumentation, Physical Reasoning Objects: — Fonte: Testo (PDF) — p.1 Soluzione: Soluzioni (PDF)
- Thermally insulating material for the thermostat.
*thermal insulated and plated *
Topic: Thermodynamics Metodi: Physical Modeling Competenze: Measurement & Instrumentation, Physical Reasoning Objects: — Fonte: Testo (PDF) — p.1 Soluzione: Soluzioni (PDF)
- Cavo connettore tra scheda e tablet, con presa USB Micro-B sul lato tablet.
Topic: Circuits Metodi: Physical Modeling Competenze: Measurement & Instrumentation, Physical Reasoning Objects: Wire Fonte: Testo (PDF) — p.1 Soluzione: Soluzioni (PDF)
- Card and tablet connector cable, with Micro-B USB socket on the tablet side.
Topic: Circuits Metodi: Physical Modeling Competenze: Measurement & Instrumentation, Physical Reasoning Objects: Wire Fonte: Testo (PDF) — p.1 Soluzione: Soluzioni (PDF)
- Tablet touchscreen con l’app IPhO 2021 Experiments (manuale utente dell’app fornito di seguito).
Topic: Circuits Metodi: Physical Modeling Competenze: Measurement & Instrumentation, Physical Reasoning Objects: — Fonte: Testo (PDF) — p.1 Soluzione: Soluzioni (PDF)
- Tablet touchscreen with the IPhO 2021 Experiments app (user manual of the app provided below).
Topic: Circuits Metodi: Physical Modeling Competenze: Measurement & Instrumentation, Physical Reasoning Objects: — Fonte: Testo (PDF) — p.1 Soluzione: Soluzioni (PDF)
- Termometro (disponibile nella sala esami). Experiment G1-2 Italiano (Italy) La temperatura del termostato viene misurata utilizzando il termistore NTC (Negative Temperature Coefficient), la sua resistenza dipende dalla temperatura assoluta T (in Kelvin) come segue: R(T) = R0eB/T, (1) B= 3500 K, e R0 è una costante che va determinata dalla temperatura ambiente nota, prima di attivare il riscaldamento. Il valore di questa costante è necessario per entrambi gli esperimenti. La temperatura del termostato può essere controllata modificando la corrente di riscaldamento (attraverso la app). Dopo aver modificato la corrente di riscaldamento, è necessario attendere che il sistema raggiunga una temperatura stabile. D’altra parte, si assume che l’equilibrio termico tra i componenti (condensatori, NTC e LED) avvenga ”istantaneamente” senza che si verifichi alcun ritardo significativo. Experiment G1-3 Italiano (Italy) Per garantire condizioni termiche più stabili, sopra il termostato è stato posto uno strato di materiale isolante e pressato su di esso mediante una piastrina di plastica trattenuta da due viti. Attenzione: Evita di danneggiare la scheda e i connettori dei cavetti su di essa, assicurati di collegare tutto correttamente senza forzare eccessivamente. I liquidi non si mescolano bene con l’elettronica, quindi fai attenzione quando maneggi i liquidi (come l’acqua potabile) vicino al setup sperimentale. Non sputarci sopra per sbaglio. Experiment G1-4 Italiano (Italy) Manuale d’uso dell’app IPhO 2021 Experiments Il software IPhO 2021 Experiments può essere avviato dalla schermata iniziale del tablet (o dalla lista delle app, accessibile scorrendo lo schermo dal basso verso l’alto) toccando l’icona IPhO. Per trasferire sul tablet i valori misurati sulla scheda:
Topic: Thermodynamics, Electrostatics, Circuits Metodi: Experimental Data Analysis, Physical Modeling, Graph Linearization Competenze: Experimental Data Analysis, Graph Linearization, Mathematical Modeling Objects: Resistor Fonte: Testo (PDF) — p.1 Soluzione: Soluzioni (PDF)
- Thermometer (available in the exam room). Experiments G1-2 Italian (Italy) The thermostat temperature is measured using the NTC thermistor (Negative Temperature Coefficient), its resistance depends on the absolute temperature T (in Kelvin) as follows: R(T) = R0eB/T, (1) B= 3500 K, and R0 is a constant that must be determined by the known ambient temperature, before activating the heating. The value of this constant is necessary for both experiments. The temperature of the thermostat can be controlled by changing the heating current (through the app). After changing the heating current, it is necessary to wait for the system to reach a the temperature is stable. On the other hand, the thermal balance between the components (capacitors, NTCs) is assumed to be The Commission shall adopt implementing acts in accordance with Article 21 of Regulation (EC) No 1272/2006. Experiments G1-3 Italian (Italy) To ensure more stable thermal conditions, a layer of material was placed above the thermostat. Insulating and pressed on it by a plastic plate held together by two screws.
- Watch out for this. Avoid damaging the card and the connectors of the cables on it, make sure you connect everything The Commission shall adopt the measures necessary to ensure that the measures taken are implemented in a manner consistent with the objectives of the programme. Liquids do not mix well with electronics, so be careful when handling liquids (such as The water is not available for drinking. Don’t spit on us by mistake. Experiments G1-4 Italian (Italy) Manual of use of the IPhO 2021 Experiments app The IPhO 2021 Experiments software can be started from the tablet’s initial screen (or from the list) The app is accessible by scrolling the screen from bottom to top) by tapping the IPhO icon. To transfer the measured values on the board to the tablet:
Topic: Thermodynamics, Electrostatics, Circuits Metodi: Experimental Data Analysis, Physical Modeling, Graph Linearization Competenze: Experimental Data Analysis, Graph Linearization, Mathematical Modeling Objects: Resistor Fonte: Testo (PDF) — p.1 Soluzione: Soluzioni (PDF)
- alimentare la scheda tramite caricatore USB;
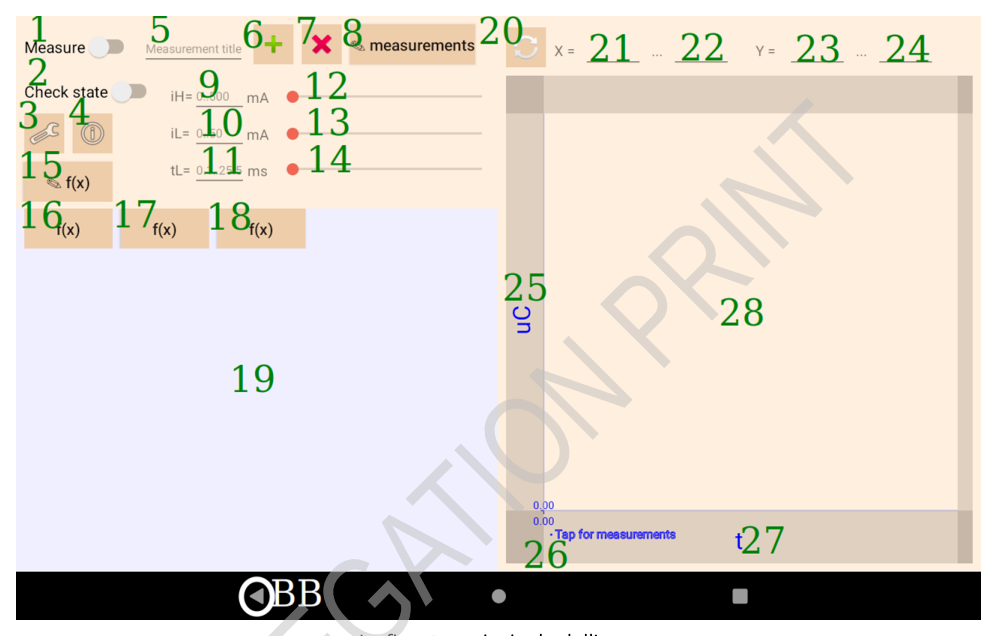 finestra principale app con controlli numerati
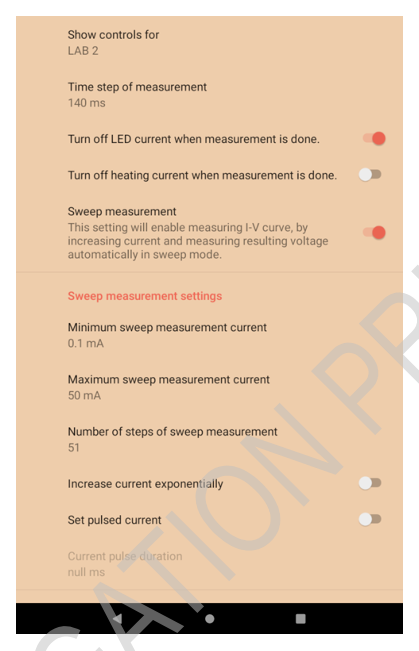 finestra impostazioni sweep misurazione
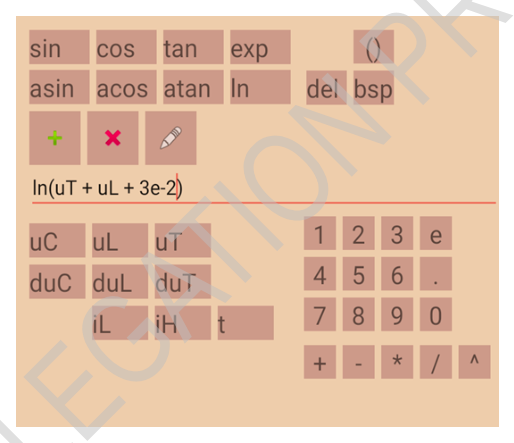 tastiera inserimento funzione personalizzata
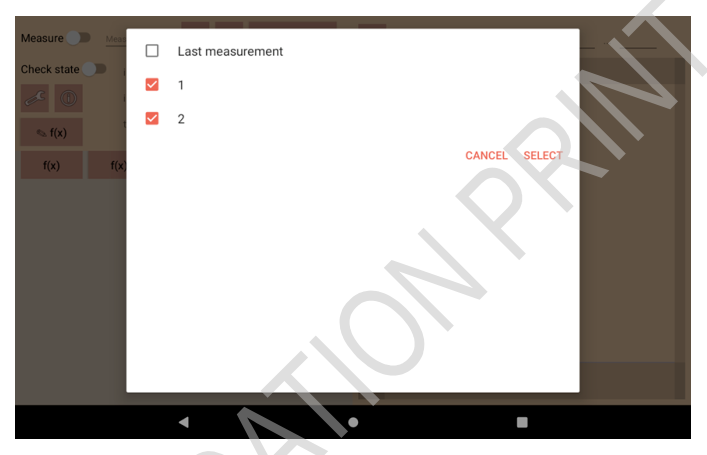 visualizzazione grafico misurazioni salvate
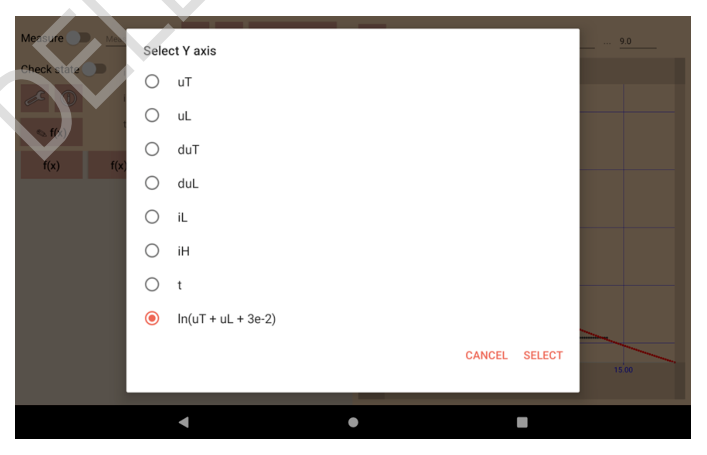 grafico con coordinate punto selezionato
Topic: Circuits Metodi: Physical Modeling Competenze: Measurement & Instrumentation, Physical Reasoning Objects: — Fonte: Testo (PDF) — p.4 Soluzione: Soluzioni (PDF)
- Power the card via a USB charger;
app main window with numbered controls
The following information is provided by the manufacturer:
The following table shows the following information:
graphic display saved measurements
graph with coordinates selected point
Topic: Circuits Metodi: Physical Modeling Competenze: Measurement & Instrumentation, Physical Reasoning Objects: — Fonte: Testo (PDF) — p.4 Soluzione: Soluzioni (PDF)
- collegare la scheda e il tablet tramite il cavo connettore (6 pin lato scheda e Micro-USB lato tablet);
Topic: Circuits Metodi: Physical Modeling Competenze: Measurement & Instrumentation, Physical Reasoning Objects: Wire Fonte: Testo (PDF) — p.4 Soluzione: Soluzioni (PDF)
- connect the card and tablet via the connector cable (6 card side pins and Micro-USB side tablet);
Topic: Circuits Metodi: Physical Modeling Competenze: Measurement & Instrumentation, Physical Reasoning Objects: Wire Fonte: Testo (PDF) — p.4 Soluzione: Soluzioni (PDF)
- confermare l’accesso USB e premere sul tasto reset della scheda entro 10 secondi da quando l’app ti chiede di farlo. Attenzione: se ad un certo momento • – la scheda smette di rispondere e non restituisce alcuna misurazione (né nello ’Check state’ né in Measurement mode), • – il riscaldamento / la corrente del LED non cambia (la tensione del termistore non cambia e il LED non si accende anche alla massima corrente del LED), premere il pulsante RESET sulla scheda ed eseguire il passaggio 3 ”conferma l’accesso USB…” Se non è sufficiente: • uscire dall’app toccando due volte il pulsante Indietro, • scollegare la scheda, • aprire di nuovo l’app, • ricollegare la scheda ed eseguire il passaggio 3 sopra descritto. Experiment G1-5 Italiano (Italy) I controlli e i campi sono (i numeri verranno utilizzati come riferimenti in seguito): La finestra principale dell’app. • 1 - Toccando questo interruttore si avvia una sessione di misurazione. Toccandolo di nuovo si ferma. • 2 - Quando questo interruttore è selezionato, lo schermo mostra i valori in tempo reale delle misurazioni. • 3 - Apre le impostazioni • 4 - Visualizza un breve riepilogo delle impostazioni. • 5 - Titolo della misura da salvare o cancellare. • 6 - Salva con un nuovo nome una misurazione appena misurata o selezionata. • 7 - Elimina la misura selezionata. • 8 - Seleziona una misurazione precedentemente salvata. • 9, 10, 11 - Campi di testo per inserire manualmente i valori di corrente di riscaldamento (9), corrente LED (10), durata impulso corrente LED (11). I valori vuoti significano 0. tL (durata impulso corrente LED) = 0 significa corrente continua costante. • 12, 13, 14 - Cursori per modificare i valori corrispondenti (la corrente del LED cambia in modo esponenziale!). • 15 - Apre l’editor delle funzioni. • 16, 17, 18 - Seleziona variabili o funzioni per le colonne della tabella di misurazione. Experiment G1-6 Italiano (Italy) • 19 - Zona della tabella delle misure. • 20 - Ricalcola manualmente le misurazioni in un grafico. • 21, 22 - Limiti minimo e massimo dell’asse X (possono essere inseriti manualmente premendo poi il pulsante di ricalcolo). • 23, 24 - Limiti minimo e massimo dell’asse Y. • 25, 27 - Seleziona gli assi Y e X del grafico. • 26 - Seleziona le misure da tracciare sul grafico. • 28 - Zona del grafico. • BB - Il pulsante Indietro del sistema operativo Android (tocca due volte per chiudere l’app). Impostazione di una misurazione della curva I-V di scansione Ulteriori controlli LED sono disponibili per LAB 2 toccando il pulsante delle impostazioni (3) della finestra principale. Nella finestra che si apre seleziona: • ”LAB 2” o ”ANY LAB” nella sezione ”Mostra controlli per”. • attivare l’opzione ”Misura sweep”. Altre impostazioni sono: • ”Minimo…” e ”Massima corrente di misurazione della scansione” impostano rispettivamente il valore iniziale e l’ultimo valore della corrente del LED durante la misurazione della scansione. • ”Numero di passaggi della misurazione dello sweep” indica quanti passaggi di misurazione verranno effettuati. • scegli ”Aumenta la corrente secondo la progressione geometrica” se vuoi che la corrente aumenti in modo esponenziale. • scegliere ”Imposta corrente pulsata” e impostare ”Larghezza impulso corrente” se si desidera che ogni valore venga misurato utilizzando un impulso di tempo limitato della corrente del LED. Ad esempio, se il numero di passi è 51, ’Aumenta corrente secondo progressione geometrica’ è spento, la corrente del LED cambia rispettivamente da 0 mA a 50 mA, la corrente del LED durante la misurazione sarà 0 mA, 1 mA, .. 49 mA e 50 mA. Ora puoi iniziare a misurare la curva I-V dopo essere tornato alla finestra principale premendo il pulsante Indietro. Experiment G1-7 Italiano (Italy) Funzioni di modifica Toccando il pulsante (15) della finestra principale si apre la finestra di modifica delle funzioni. Le funzioni create possono accettare alcune delle variabili (e loro derivate) misurate direttamente sulla scheda. Sono: • differenze di potenziale (in V): – uC - al condensatore selezionato (C1 o C2); – uT - al termistore; – uL - al LED; • loro derivate rispetto al tempo (dy/dt) (in V/s): – duC – duT – duL • le correnti (in mA): – iL - al LED (in mA); – iH - corrente di riscaldamento (in mA); • tempo t (in s). Experiment G1-8 Italiano (Italy) E’ possibile inserire una funzione personalizzata utilizzando queste variabili e funzioni matematiche (utilizzando pulsanti di supporto o una tastiera Android standard) di tua scelta e salvarla premendo successivamente il pulsante verde +. Le funzioni salvate possono essere utilizzate come assi del grafico o come colonne della tabella di misura. Il pulsante matita seleziona le funzioni esistenti. Le funzioni selezionate possono essere eliminate premendo il pulsante rosso x. Per i numeri sono accettabili sia il formato decimale usuale (e.g. 25.02) che il formato scientifico (e.g. 2.502e+1). • * è operatore di moltiplicazione, • / è l’operatore di divisione, • ̂ è l’operatore di elevamento a potenza. Experiment G1-9 Italiano (Italy) Visualizzazione delle misurazioni La misura finita può essere salvata inserendo il suo nome nel campo (5) della finestra principale e premendo il pulsante verde + (6) vicino. I dati di misura grezzi vengono salvati, e possono essere in seguito visualizzati su qualsiasi altro asse. Le misurazioni salvate possono essere visualizzate sul grafico toccando l’area vicino all’angolo del grafico (26). E’ possibile eseguire una panoramica/ingrandire il grafico e, se lo si tocca nel punto esatto, verrà contrassegnato il punto più vicino della misurazione (se non esistono punti di misurazione vicini a quello toccato) o il punto stesso e le sue coordinate visualizzate. L’asse può essere scelto toccando le etichette degli assi esistenti (aree del grafico 25 e 27).
Topic: Circuits, Electrostatics, Thermodynamics Metodi: Experimental Data Analysis, Graph Linearization, Physical Modeling Competenze: Experimental Data Analysis, Graph Linearization, Measurement & Instrumentation Objects: Capacitor, Resistor Fonte: Testo (PDF) — p.4 Soluzione: Soluzioni (PDF)
- confirm USB access and press the card reset button within 10 seconds of the app He’s asking you to. Please note: if at any time • the card stops responding and does not return any measurements (even in Check) the measurement mode is not used, • the heating / current of the LED does not change (the voltage of the thermistor does not change) the LED is switched on and the LED is not switched on even at the maximum current of the LED), Press the RESET button on the card and run step 3 confirm the USB access… If that ‘s not enough: • exit the app by double-taping the Back button, • disconnect the card, • re-open the app, • reconnect the sheet and perform step 3 as described above. Experiments G1-5 Italian (Italy) The controls and fields are (numbers will be used as references below): The main window of the app. • 1 - A measurement session is started by touching this switch. Touch it again and it stops. • 2 - When this switch is selected, the screen displays the measurement values in real time. • 3 - Open the settings • 4 - Display a brief summary of the settings. • 5 - Title of the measure to be saved or deleted. • 6 - Save a newly measured or selected measurement by a new name. • 7 - Remove the selected measure. • 8 - Select a previously saved measurement. • 9, 10, 11 - Text fields for manually entering heating current values (9), current The LEDs shall be used for the purpose of the measurement of the current pulse. The empty values are 0. tL (current pulse duration) LED) = 0 means constant direct current. • 12, 13, 14 - Courses to change the corresponding values (the current of the LED changes exponentially!). • 15 - Open the editor of the functions. • 16, 17, 18 - Select variables or functions for the columns of the measurement table. Experiments G1-6 Italian (Italy) • 19 - Area of the table of measures. • 20 - Manually calculate the measurements in a graph. • 21, 22 - Minimum and maximum limits of the X axis (can be entered manually by pressing the the recalculator button). • 23, 24 - Minimum and maximum limits of the Y axis. • 25, 27 - Select the Y and X axes of the graph. • 26 - Select the measures to be traced on the chart. • 28 - Area of the chart. • BB - The Back button of the Android operating system (tap twice to close the app). Set a measurement of the I-V scan curve Additional LED controls are available for LAB 2 by tapping the settings (3) button of the window The principal. In the window that opens, select: • LAB 2 or ANY LAB in the Mostra controls for. • activate the Measure sweep option. Other settings are: • Minimum… and Major current of scanning measurement set the the initial and last values of the LED current during the scan measurement. • Number of measurement steps of the sweep indicates how many measurement steps will be taken. • choose Increase current according to geometric progression if you want the current to increase exponentially. • select Push current and set Light current pulse if desired Each value is measured using a limited time pulse of the LED current. For example, if the number of steps is 51, Agrees current geometrically is turned off, the The LED current shall change from 0 mA to 50 mA respectively, the LED current during the measurement shall be 0 mA, 1 mA, .. 49 mA e 50 mA. Now you can start measuring the I-V curve after you’ve returned to the main window by pressing the button.
- Get back in the car. Experiments G1-7 Italian (Italy) The following information shall be provided: The function modification window is opened by pressing the main window button (15). The functions created can accept some of the variables (and their derivatives) measured directly on the The card. They ‘re: • differences in potential (in V): uC - the selected capacitor (C1 or C2); uT - the thermistor; uL - to the LED; • their time-to-time derivatives (dy/dt) (in V/s): duc duT two • current (in mA): iL - to the LED (in mA); iH - heating current (in mA); • time t (in s). Experiments G1-8 Italian (Italy) You can also enter a custom function using these variables and mathematical functions (using support buttons or a standard Android keyboard) of your choice and save it by pressing the green + button. The saved functions can be used as a graph axis or as a columns of the measuring table. The pencil button selects the existing functions. The selected functions can be removed by pressing the red x button. For numbers both the usual decimal formats are acceptable (e.g. The scientific format (e.g. 2.502e+1). • * is a multiplication operator, • / is the division operator, • ̂ is the power lift operator. Experiments G1-9 Italian (Italy) View of measurements The finished measurement can be saved by entering its name in the field (5) of the main window and pressing the nearby green + (6) button. The raw measurement data is saved, and can be The following information is provided for in the table below: The saved measurements can be displayed on the chart by tapping The area near the angle of the graph (26). E you can perform an overview/enlarge the chart and, if you touch it at the exact point, the nearest point of measurement (if there are no measurement points near the point touched) or the point itself and its displayed coordinates. The axis can be selected by touching the labels of existing axes (area of graph 25 and 27).
Topic: Circuits, Electrostatics, Thermodynamics Metodi: Experimental Data Analysis, Graph Linearization, Physical Modeling Competenze: Experimental Data Analysis, Graph Linearization, Measurement & Instrumentation Objects: Capacitor, Resistor Fonte: Testo (PDF) — p.4 Soluzione: Soluzioni (PDF)