Misure di ottica
Experiment Q1-1 Italiano (Italy) Misure di ottica In questo esperimento, si misureranno le proprietà ottiche di sistemi fisici con la massima precisione possibile utilizzando l’attrezzatura disponibile. Nota: sotto il tavolo ci sono due bottiglie d’acqua che si useranno nel secondo esperimento - non devi berle. Nella parte A si useranno due metodi diversi per misurare l’indice di rifrazione di un disco trasparente. Il primo metodo è tradizionale, mentre il secondo è più originale e consente un livello superiore di precisione. Nella parte B si misurerà il rapporto tra la lunghezza d’onda λdel laser e il passo di un reticolo di diffrazione, d, con l’obiettivo di ottenere il massimo livello possibile di accuratezza. Nella parte C si misurerà l’indice di rifrazione di un prisma triangolare, con l’obiettivo di raggiungere il massimo livello di accuratezza. Durante lo svolgimento degli esperimenti, il locale dove si svolgerà la prova verrà oscurato per 100 minuti, a partire da 20 minuti dopo l’inizio della prova (è possibile utilizzare una lampada da tavolo quando è necessario avere a disposizione della luce). È meglio lavorare, nella parte A dell’esperimento restando al buio, ma è anche possibile lavorare per la maggior parte del tempo alla luce. È possibile utilizzare le pareti del cubicolo come schermo e applicare nastri adesivi sulle pareti stesse. In questi esperimenti, si userà un laser a diodi come sorgente luminosa. Istruzioni sulla sicurezza con il laser • MAI guardare direttamente dentro la sorgente del fascio laser! In tutti gli esperimenti, il raggio laser è orizzontale. Quando si misura la posizione del raggio laser su una superficie, assicurarsi che la testa sia SEMPRE al di sopra del livello del raggio. • Non puntare il raggio laser verso l’apertura del cubicolo. • Spegnere il laser quando non si eseguono misurazioni. Materiali e strumenti a disposizione I pezzi dall’1 al 9 vengono adoperati in ognuna delle tre parti dell’esperimento, gli oggetti dal 10 al 12 vengono usati ciascuno in una sezione diversa dell’esperimento. Attenzione che vengono messi a disposizione diversi sistemi ottici - non toccare le pareti verticali di nessuno di essi per evitare di sporcarle
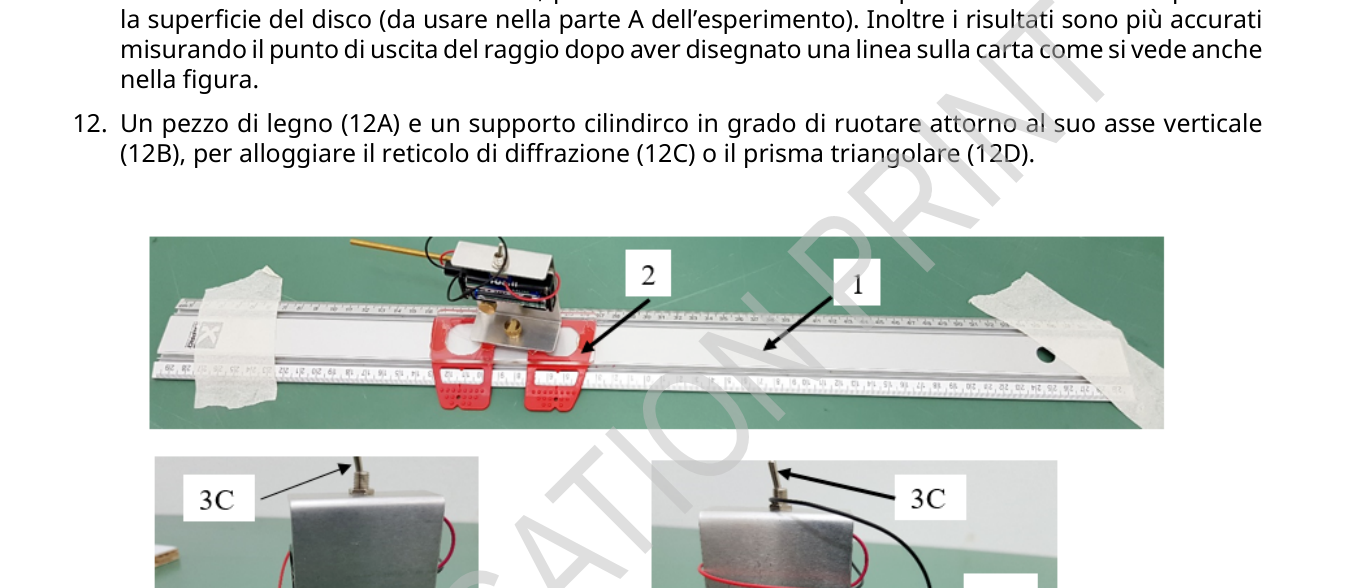
- Righello da 60 cm di lunghezza
- Cursore che può essere mosso lungo il righello
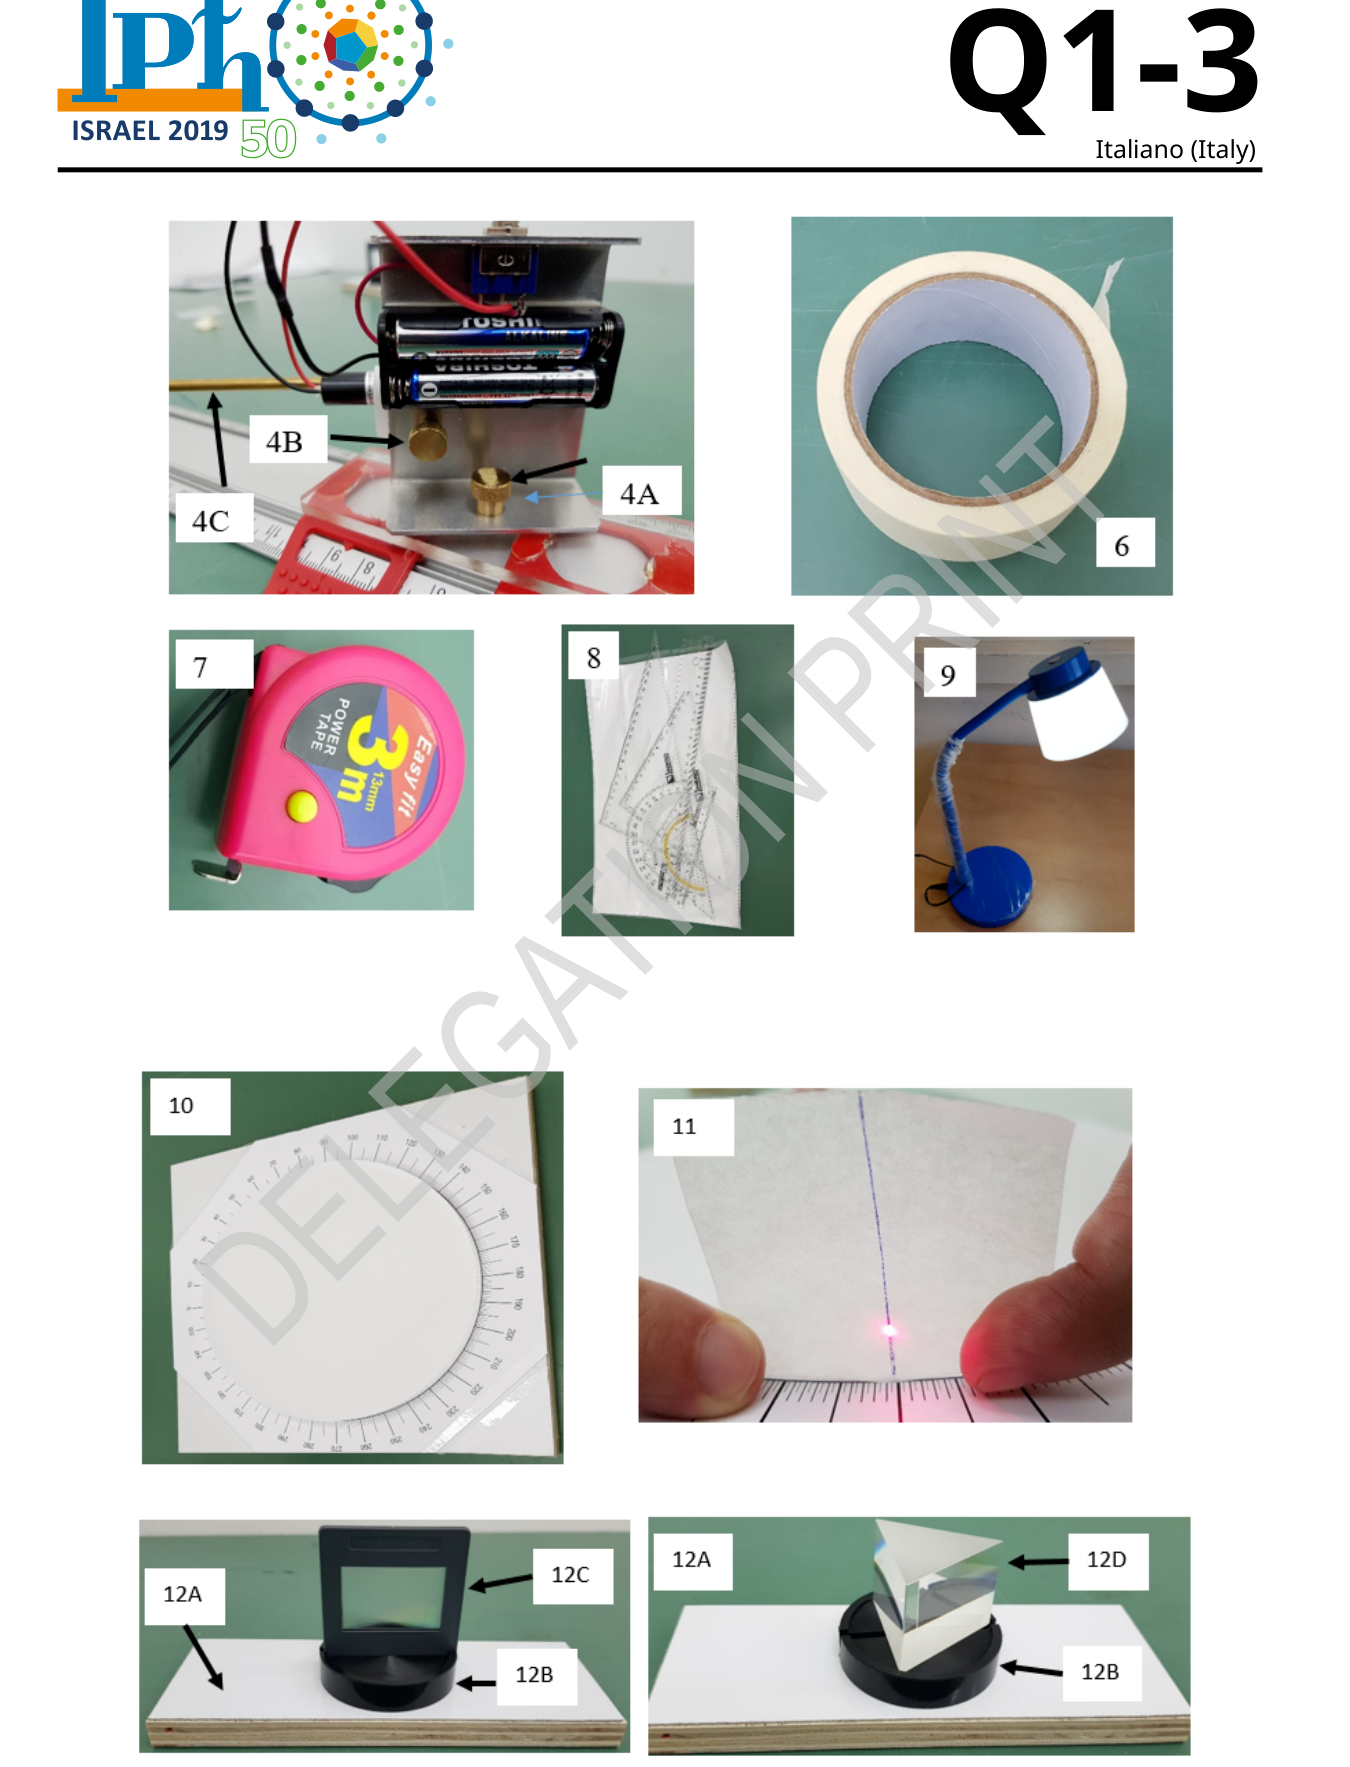
- Sorgente laser montata sul cursore. Il laser può essere impostato su due livelli: livello basso, 3A, per la parte A dell’esperimento e livello alto 3B per le parti B e C. L’interruttore on / off del laser è indicato con il simbolo ”3C” nella figura.
- La tensione esercitata dalle viti 4A e 4B controlla la rotazione e, in definitiva, la stabilità dell’apparato. Utilizzare la barra di metallo piccola 4C per cambiare la direzione del laser. Ruotare 4C di per modificare l’altezza del laser. Non ruotare il laser attorno all’asse del fascio, poiché la polarizzazione del fascio è stata già predisposta.
- Schermo di proiezione: si usano le pareti del cubicolo; si può assumere che le pareti siano perpendicolari una rispetto all’altra.
- Un rotolo di nastro adesivo da usare per fissare l’apparecchiatura al tavolo
- Metro flessibile
Experiment Q1-2 Italiano (Italy) 8. Un set di materiale da disegno: squadrette, goniometro, eccetera 9. Lampada da tavolo 10. Disco trasparente rotondo con un diametro di 20,00 cm, fissato su un goniometro, incollato su una base di legno (da usare nella parte A). Rimuovere i 4 piccoli cubetti attaccati alla base di legno 11. Carta velina, o pergamena, da utilizzare come schermo trasparente, tenendola temporaneamente fissa con la mano sul lato del disco, per consentire di misurare il punto di uscita senza sporcare la superficie del disco (da usare nella parte A dell’esperimento). Inoltre i risultati sono più accurati misurando il punto di uscita del raggio dopo aver disegnato una linea sulla carta come si vede anche nella figura. 12. Un pezzo di legno (12A) e un supporto cilindirco in grado di ruotare attorno al suo asse verticale (12B), per alloggiare il reticolo di diffrazione (12C) o il prisma triangolare (12D).
Experiment Q1-3 Italiano (Italy)
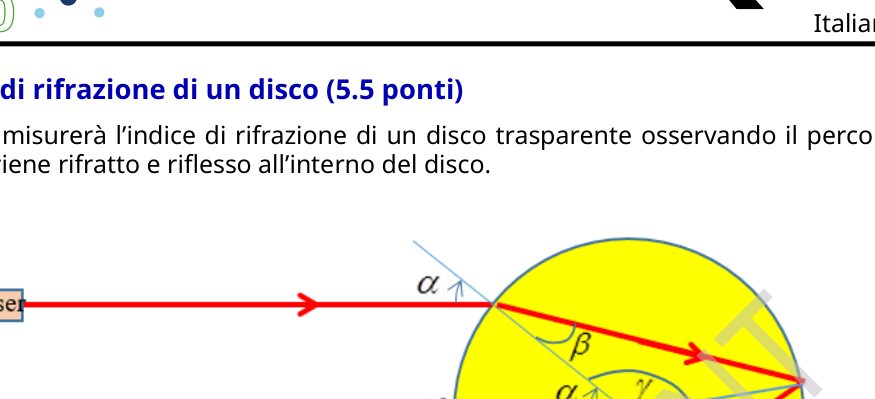
Experiment Q1-4 Italiano (Italy) Parte A. L’indice di rifrazione di un disco (5.5 ponti) In questa parte, si misurerà l’indice di rifrazione di un disco trasparente osservando il percorso di un raggio di luce che viene rifratto e riflesso all’interno del disco. Una rappresentazione schematica dell’esperimento
Definizioni e simboli α Angolo incidente tra il disco e il raggio in ingresso Allargamento angolare dell’angolo incidente, cioè l’ampiezza dell’intervallo di valori dell’angolo incidente α β Angolo di rifrazione all’interno del disco γ = n Indice di rifrazione del materiale di cui è fatto il disco N Numero di volte in cui il raggio va a colpire il bordo del disco prima di emergere in aria (nello schizzo N= 3) δ Angolo tra la direzione opposta a quella del raggio in ingresso e la direzione del raggio in uscita, misurata in senso orario (lo schizzo mostra l’angolo δper N= 3) Allargamento angolare di δ Si può dimostrare che gli angoli α, βe δsono legati dalla relazione: δ= 2α+ ) . (1) L’equazione data si può usare senza ricavarla. Fissare il righello al tavolo per controllare l’angolo di incidenza del raggio laser, usando il nastro adesivo, e regolare, quindi, il laser in modo che sia possibile misurare facilmente l’angolo del raggio incidente. Fissare il disco al tavolo incollando il nastro adesivo agli angoli della base di legno e al tavolo. Regolare l’inclinazione con la barra di metallo 4C. Il laser può essere sistemato a due altezze diverse: il livello
Experiment Q1-5 Italiano (Italy) basso è da usare per la parte A dell’esperimento, il livello alto per le parti B e C. Il laser è stato sistemato in anticipo in modo che il raggio incidente si trovi nello stato di polarizzazione S (cioè una polarizzazione in cui la riflessione è più alta). Non si modifichi mai la polarizzazione del raggio incidente (cioè non si ruoti mai il laser attorno al proprio asse)! A.1 Disegnare schematicamente il sistema mostrando il righello con il cursore, il disco e il percorso del raggio laser. Indicare anche l’angolo di incidenza α. Eseguire una serie di misurazioni comprese nell’intervallo di angoli 75∘, e scrivere nella tabella 1 α, , δ, . Nota: per misurare δ, va meglio misurare δ/2 direttamente sul disco. 1.0pt A.2 Usando le misurazioni svolte nel punto precedente, tracciare un grafico opportuno da cui ricavare l’indice di rifrazione ne l’errore sperimentale . Può servire calcolare quantità intermedie, e adoperare le colonne vuote della Tabella 1 per queste quantità. Trovare l’indice di rifrazione ne l’errore di misura . 1.0pt A.3 Con i dati rilevati in A1, disegnare il grafico di δin funzione di α. Indicare per ogni punto disegnato anche le barre d’errore . Eseguire un’ulteriore misurazione per trovare in modo accurato il minimo valore di δ, e il corrispondete α. Chiamare questi risultati δmin e αmin. Per identificare il punto minimo con la massima precisione, si possono utilizzare le pareti del cubicolo come schermo per proiettare il raggio in uscita. 0.5pt Un secondo modo per misurare l’indice di rifrazione In questa sezione dell’esperimento, verrà sviluppato un metodo alternativo per ottenere dei risultati molto accurati. Anche se si richiede di misurare l’indice di rifrazione al più alto livello di precisione possibile, non è richiesto di calcolare gli errori di misura. Ciononostante, si devono ricavare nel dettaglio le formule che si useranno per ottenere il risultato finale. Scrivere tali formule nel foglio risposta. A.4 Basando il ragionamento sull’andamento del grafico disegnato nel punto A3, scegliere l’angolo ottimale per realizzare le misurazioni necessarie per determinare l’indice di rifrazione. Scrivere l’equazione da usare per ottenere l’indice di rifrazione secondo il metodo sviluppato. 0.7pt A.5 Con N= 3, eseguire le misurazioni necessarie per calcolare l’indice di ri
p.2 — Foto dell’apparato sperimentale con laser e disco
p.3 — Componenti e materiali a disposizione
p.4 — Schema della rifrazione della luce in un disco
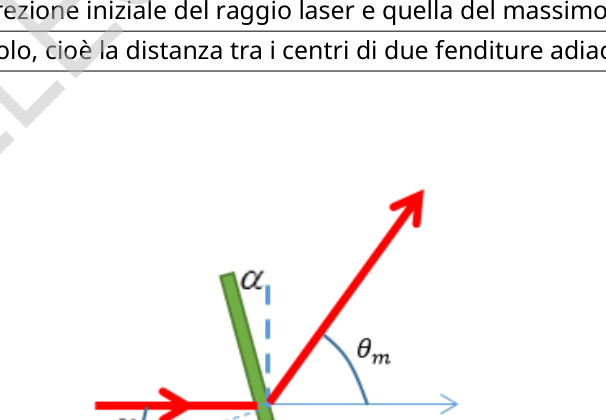
p.6 — Geometria della diffrazione su reticolo
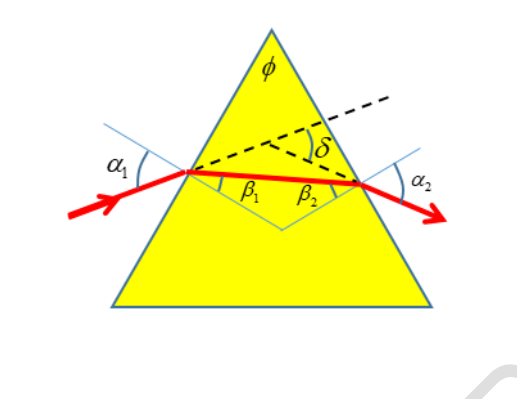
p.8 — Rifrazione della luce in un prisma triangolare
Topic: Geometric Optics, Wave Optics, Oscillations & Waves Metodi: Snell’s Law, Graph Linearization, Interference & Diffraction Analysis, Experimental Data Analysis Competenze: Experimental Data Analysis, Graph Linearization, Error Propagation Objects: Disk, Diffraction Grating, Prism, Screen Fonte: Testo (PDF) — p.1 Soluzione: Soluzioni (PDF)
The following is the list of the following:
Experiments Q1-1 Italian (Italy) Optical measurements In this experiment, the optical properties of physical systems will be measured with the utmost precision. The Commission will be able to take the necessary steps to ensure that the information provided is available. Note: under the table are two water bottles that will be used in the second experiment - you don’t have to I’m going to eat. In Part A, two different methods will be used to measure the refractive index of a transparent disc. The first method is traditional, while the second is more original and allows a higher level of The exactness. In Part B, the ratio of the laser wavelength to the speed of a lattice of The aim is to achieve the highest possible level of accuracy. In Part C, the refractive index of a triangular prism is measured, with the aim of achieving the maximum level of accuracy. During the experiment, the room where the test will be conducted will be dark for 100 minutes, starting 20 minutes after the start of the test (you can use a table lamp when lighting is necessary). It’s better to work on part A of the experiment while staying You can work in the dark, but you can also work in the light most of the time. You can use the walls of the cubicle as a screen and apply tape to the walls themselves. In these experiments, a diode laser will be used as a light source. Safety instructions with laser • NEVER look directly inside the source of the laser beam! In all experiments, the laser beam is horizontal. When measuring the position of the laser beam on A surface, making sure the head is ALWAYS above the beam level. • Do not aim the laser beam at the opening of the cube. • Turn off the laser when measurements are not being performed. Materials and tools available The pieces from 1 to 9 are used in each of the three parts of the experiment, the objects from 10 to 12 are each used in a different section of the experiment. Please note that they are placed on The installation of different optical systems - do not touch the vertical walls of any of them to avoid dirting them
- 60 cm length rail
- A cursor that can be moved along the reel
- Laser source mounted on the cursor. The laser can be set to two levels: low level, 3A, for part A of the experiment and high level 3B for parts B and C. The laser on/off switch is indicated by the symbol 3C in the figure.
- The voltage exerted by the 4A and 4B screws controls the rotation and ultimately the stability of the apparatus. Use the 4C small metal bar to change the direction of the laser. Rotating 4C of for change the laser height. Do not rotate the laser around the axis of the beam, as polarization The beam has already been set.
- Projection screen: the walls of the cubicle are used; it can be assumed that the walls are perpendicular to each other.
- A roll of adhesive tape to be used to attach the equipment to the table
- Flexible subway
Experiments Q1-2 Italian (Italy) 8. A set of drawing materials: squares, goniometer, etc. 9. Table lamp 10. Round transparent disc with a diameter of 20,00 cm, fixed to a goniometer, glued to a wood base (to be used in Part A). Remove the 4 small cubes attached to the base of the wood 11. Poison paper or parchment, to be used as a transparent screen, temporarily held It is fixed with the hand on the side of the disc, so that the output point can be measured without dirt. the surface of the disc (to be used in part A of the experiment). The results are also more accurate. measuring the radius output point after drawing a line on paper as you can see too In the figure. 12. A piece of wood (12A) and a cylindrical support capable of rotating around its vertical axis (12B), to house the diffraction lattice (12C) or the triangular prism (12D).
Experiments Q1-3 Italian (Italy)
Experiments Q1-4 Italian (Italy) Part A. The refractive index of a disc (5.5 bridges) In this part, the refractive index of a transparent disc will be measured by looking at the path of a a beam of light that is reflected and reflected within the disk. A schematic representation of the experiment
Definitions and symbols α Angle of incidence between the disc and the input beam Angular width of the angle of incidence, i.e. the width of the range of values of the angle of incidence α β Refraction angle within the disc γ = n Refraction index of the material of which the disc is made N Number of times the beam hits the edge of the disc before it emerges into the air (in the Figure N = 3 δ Angle between the direction opposite to that of the input beam and the direction of the input beam output, measured in clockwise (the diagram shows the δper angle N= 3) Angular width of δ The angles α, βe and δ can be shown to be related by the relation: δ= 2α+ ) . (1) The given equation can be used without deriving it. Fix the ruler to the table to control the angle of incidence of the laser beam, using the adhesive tape, and adjust the laser so that the angle of the incident beam can be easily measured. Attach the disc to the table by gluing the adhesive tape to the corners of the wooden base and the table. The rules The slope with the 4C metal bar. The laser can be set to two different heights: the level
Experiments Q1-5 Italian (Italy) The low level is used for part A of the experiment, the high level for parts B and C. The laser was fixed. In the case of a beam of radius of the same radius, the radius of the incident radius is the same as the radius of the incident radius. where reflection is higher). The polarization of the incident beam is never altered (i.e. Never turn the laser around your axis! A.1 Draw the system schematically showing the reel with the cursor, the the disc and the path of the laser beam. Also indicate the angle of incidence α. Perform a series of measurements within the angle range 75, and write in Table 1 α, , δ, . Note: to measure δ, it is best to measure δ/2 directly on the disk. 1.0pt A.2 Using the measurements made in the previous point, draw an appropriate graph to obtain the refractive index in the experimental error . It may be necessary to calculate intermediate quantities and to use the empty columns of Table 1 for these quantities. Find the refractive index in the measuring error . 1.0pt A.3 Using the data from A1, draw the graph of δin function of α. Indicate for each The error bars are also drawn. Perform a further measurement to accurately find the minimum value of δ, and you correspond to α. Call these results δmin and αmin. To identify the minimum point with the greatest precision, use the walls of the cubicle as a screen to project the output beam. 0.5pt A second way to measure the refractive index In this section of the experiment, an alternative method will be developed to obtain very accurate results. Although the refractive index is required to be measured with the highest possible accuracy, the measurement errors are not required to be calculated. However, the details of the The formulae used to obtain the final result. Write those formulas in the reply sheet. A.4 Based on the reasoning on the trend of the graph drawn in point A3, Choose the optimal angle to make the measurements necessary to determine the refractive index. Write the equation to be used to obtain the index of The method developed is refraction. 0.7pt A.5 With N=3, perform the measurements necessary to calculate the RII
p.2 Photo of the experimental apparatus with laser and disc
The following information is provided by the Commission:
The following is the list of the types of light refraction systems used:
The following table shows the results of the calculation of the net loss of the net loss of the net loss of the net loss of the net loss of the net loss of the net loss of the net loss of net loss of the net loss of net loss of net loss of net loss of net loss of net loss of net loss of net loss of net loss of net loss of net loss of net loss of net loss of net loss of net loss of net loss of net loss of net loss of net loss of net loss of net loss of net loss of net loss of net loss of net loss of net loss of net loss of net loss of net loss of net loss of net loss of net loss of net loss of net loss of net loss of net loss of net loss of net loss of net loss of net loss of net loss of net loss of net loss of net loss of net loss of net loss of net loss of net loss of net loss of net loss of net loss of net loss of net loss of net loss of net loss of net loss of net loss of net loss of net loss of net loss of net loss of net loss of net loss of net loss of net loss of net loss of net loss of net loss of net loss of net loss of net loss of net loss of net loss of net loss of net loss of net loss of net loss of net loss of net loss of net loss of net loss of net loss of net net loss of net net loss of net loss of net loss of net net net loss of net net loss of net net loss of net loss of net net net net loss of net net loss of net net net net net net net net net net net net net net net net net net net net net net net net net net net net net net net net net net net net net net net net net net net net net net net net net net net net net net net net net net net net net net net net net net net net net net net net net net net net net net net net net net net net net net net net net net net net net net net net net net net net net net net net net net net net net net net net net net net net net net net net net net net net net net net net net net net net net net net net net net net net net net net net net net net net net net net net net net net net net net net net net net net net net net net net net net net net net net net net net net
p.8 Refraction of light in a triangular prism
Topic: Geometric Optics, Wave Optics, Oscillations & Waves Metodi: Snell’s Law, Graph Linearization, Interference & Diffraction Analysis, Experimental Data Analysis Competenze: Experimental Data Analysis, Graph Linearization, Error Propagation Objects: Disk, Diffraction Grating, Prism, Screen Fonte: Testo (PDF) — p.1 Soluzione: Soluzioni (PDF)