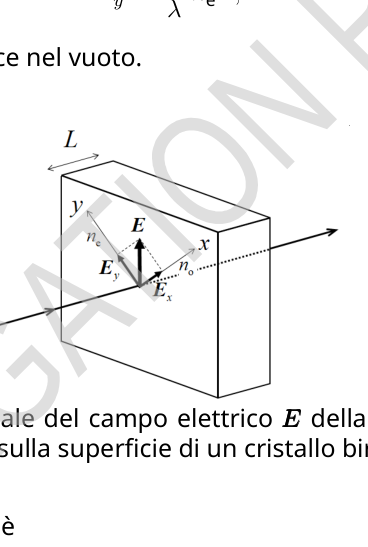
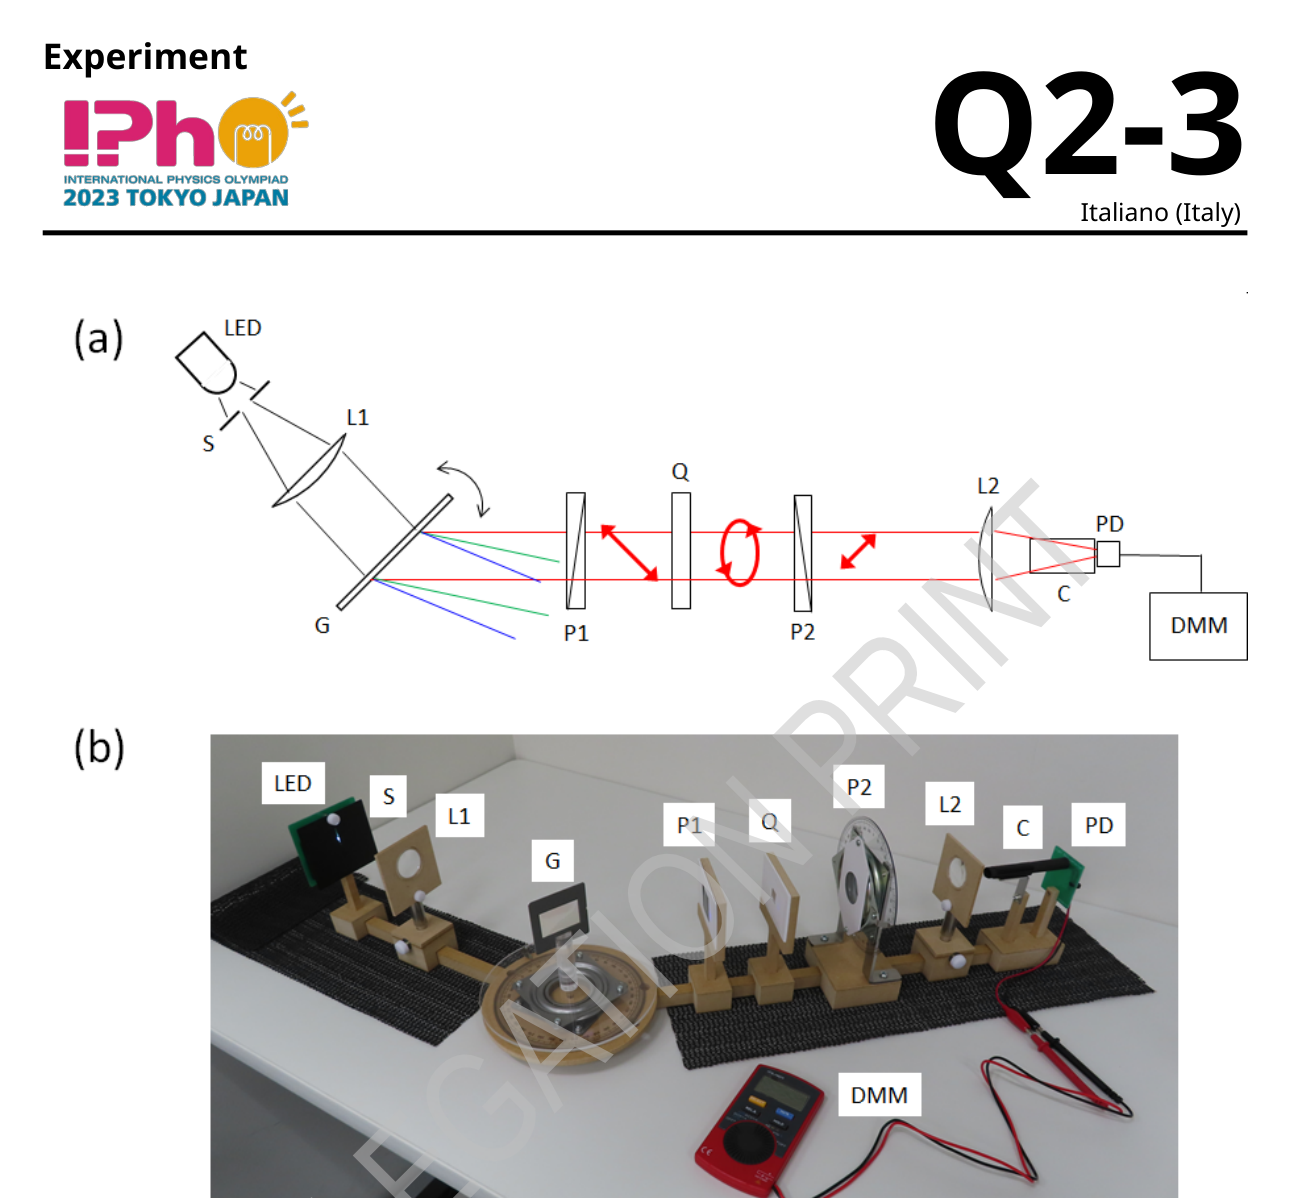
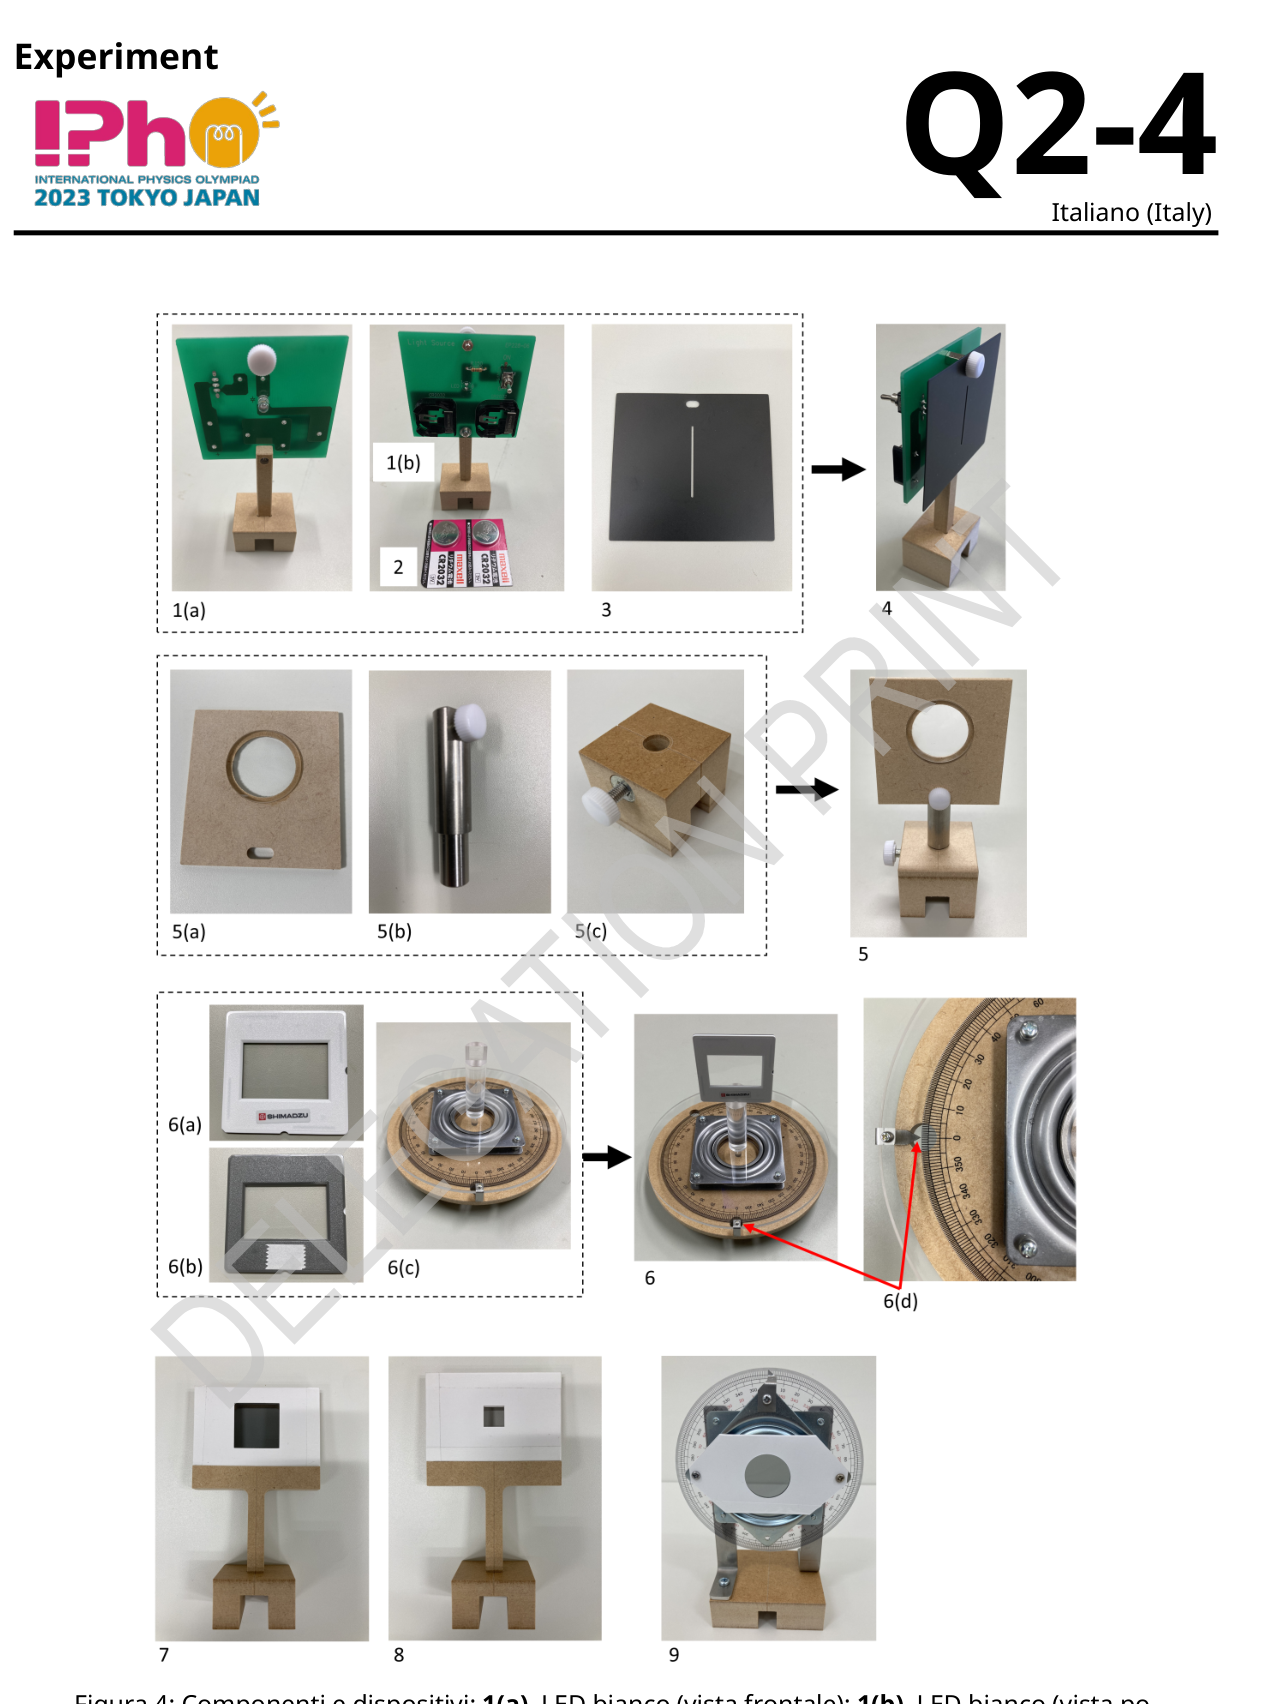
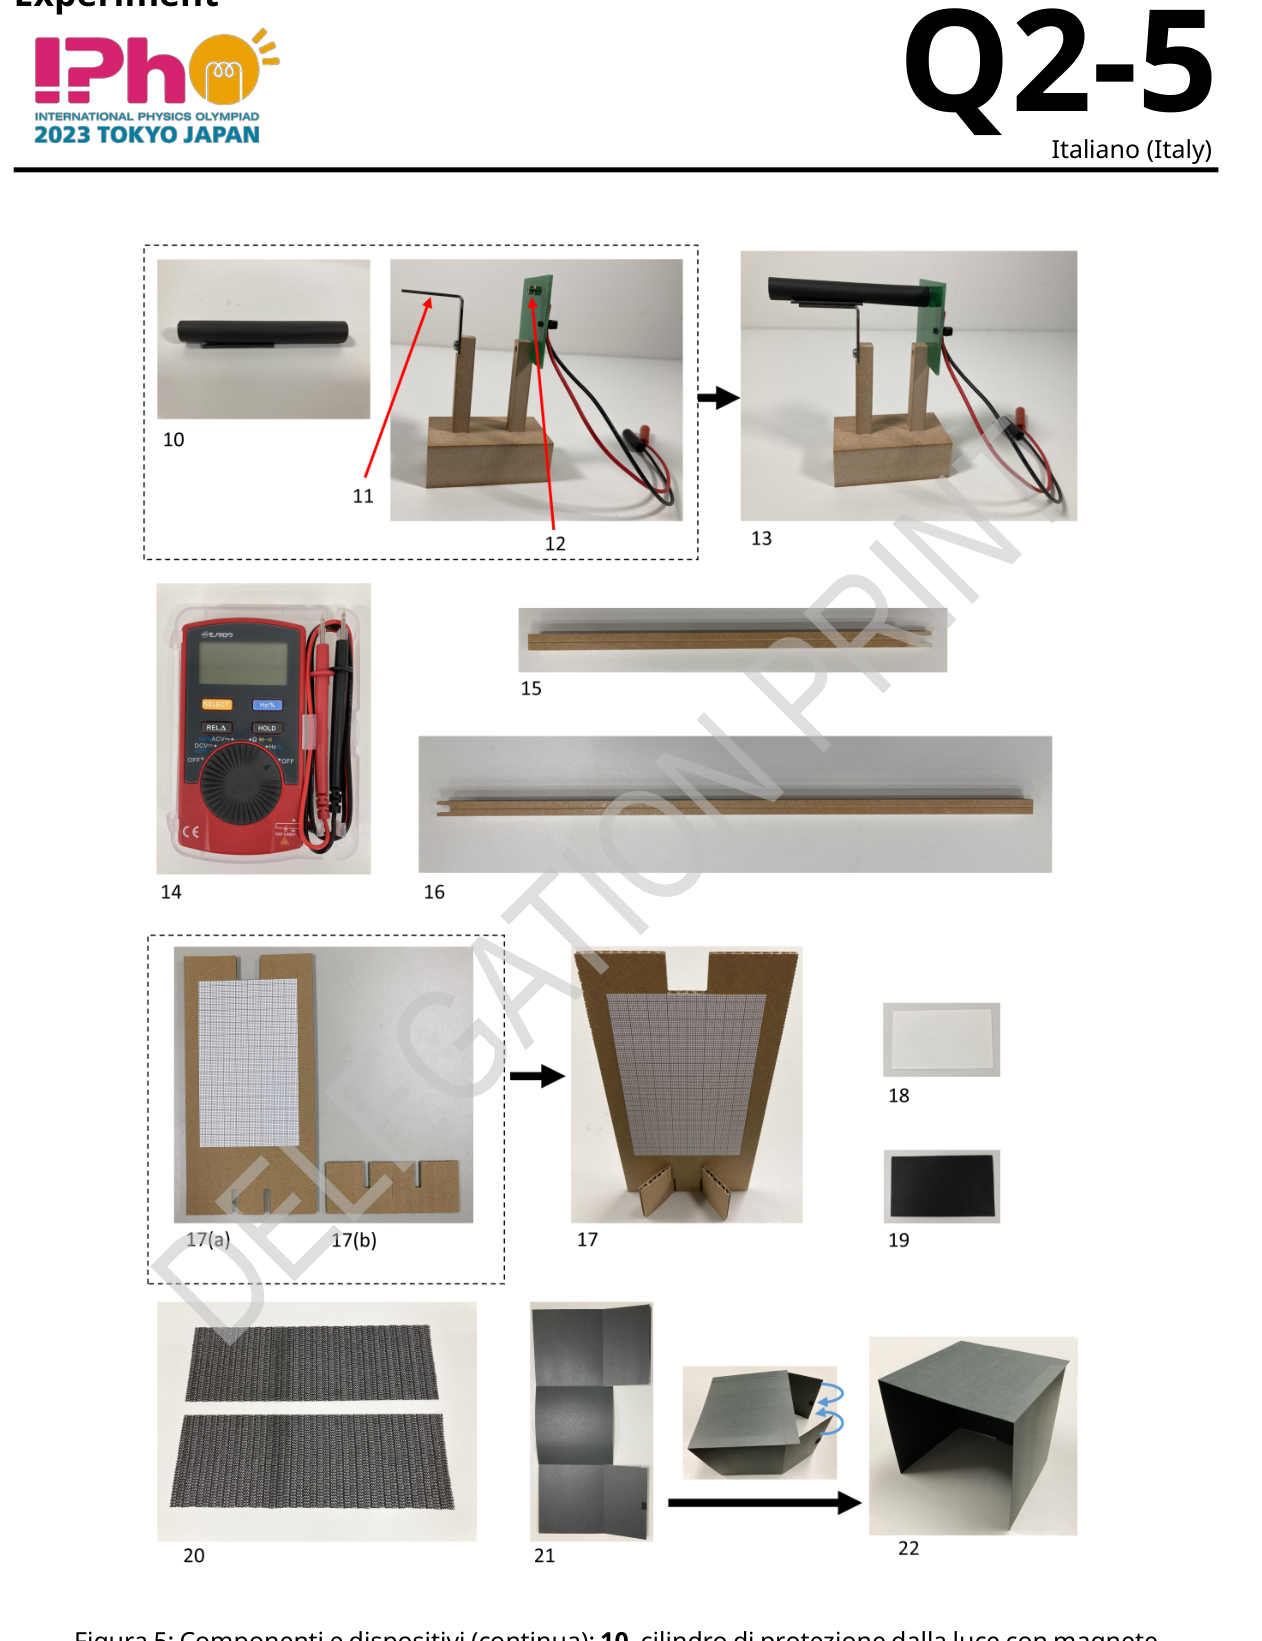
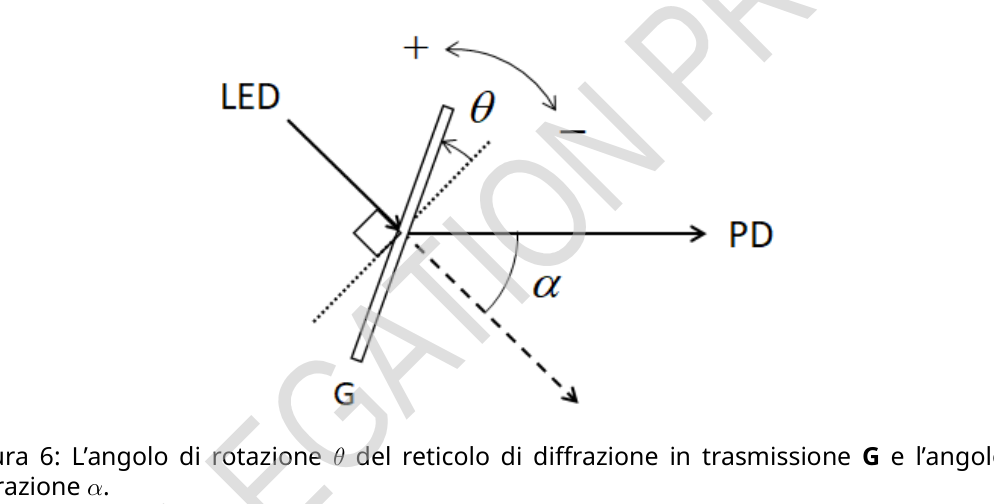
P1. La sua direzione di polarizzazione ( nella Fig. 1) è a rispetto all’asse della lastra di quarzo Q. Ruotando il polarizzatore P2 viene selezionata la componente della polarizzazione della luce dopo il passaggio attraverso Q, cioè quella parallela o quella perpendicolare alla direzione di polarizzazione di P1. Il fotorilevatore misura l’intensità della luce. Experiment Q2-3 Italiano (Italy) Figura 3: (a) Schema e (b) fotografia del dispositivo di misurazione dello spessore. LED: LED bianco, S: fenditura, L1: lente di collimazione, G: reticolo di diffrazione a trasmissione, P1: polarizzatore, Q: piastra di quarzo, P2: polarizzatore, L2: lente di messa a fuoco, C: cilindro di schermatura della luce, PD: fotorivelatore, DMM: multimetro digitale. Experiment Q2-4 Italiano (Italy) Figura 4: Componenti e dispositivi: 1(a). LED bianco (vista frontale); 1(b). LED bianco (vista posteriore); 2. batterie; 3. fenditura (S in Fig. 3); 4. LED con fenditura attaccata; 5. lente (L1, L2 in Fig. 3); 5(a) lente montata; 5(b) supporto della lente; 5(c) base del supporto; 6. reticolo di diffrazione a trasmissione (6(a) anteriore; 6(b) posteriore con nastro adesivo) su 6(c) piattaforma di rotazione (G in Fig. 3); 6(d) dispositivo di lettura dell’angolo sulla piattaforma di rotazione; 7. polarizzatore (P1 nella Fig. 3); 8. piastra di quarzo (Q nella Fig. 3); 9. polarizzatore sul supporto di rotazione (P2 nella Fig. 3). Experiment Q2-5 Italiano (Italy) Figura 5: Componenti e dispositivi (continua): 10. cilindro di protezione dalla luce con magnete (C in Fig. 3); 11. supporto del cilindro; 12. fotorilevatore (PD in Fig. 3); 13. fotorilevatore con cilindro; 14. multimetro digitale (DMM in Fig. 3); 15. guida corta; 16. guida lunga; 17. schermo con carta millimetrata; 18. cartoncino bianco; 19. cartoncino nero; 20. fogli antiscivolo; 21 & 22. scatola di protezione dalla luce (prima del montaggio e come è montata). Experiment Q2-6 Italiano (Italy) Parte A. Impostazione del sistema di misura (2.3 punti) La luce che esce dal LED è incidente sulla superficie del reticolo (Fig. 6). L’angolo di rotazione di G per l’incidenza normale è fissato a . Le rotazioni in senso antiorario e orario sono indicate rispettivamente con + e . L’angolo di diffrazione al primo ordine è definito come illustrato. Indicando con il passo della scanalatura (ossia la distanza tra le fenditure) di G, la lunghezza d’onda è data in termini di come
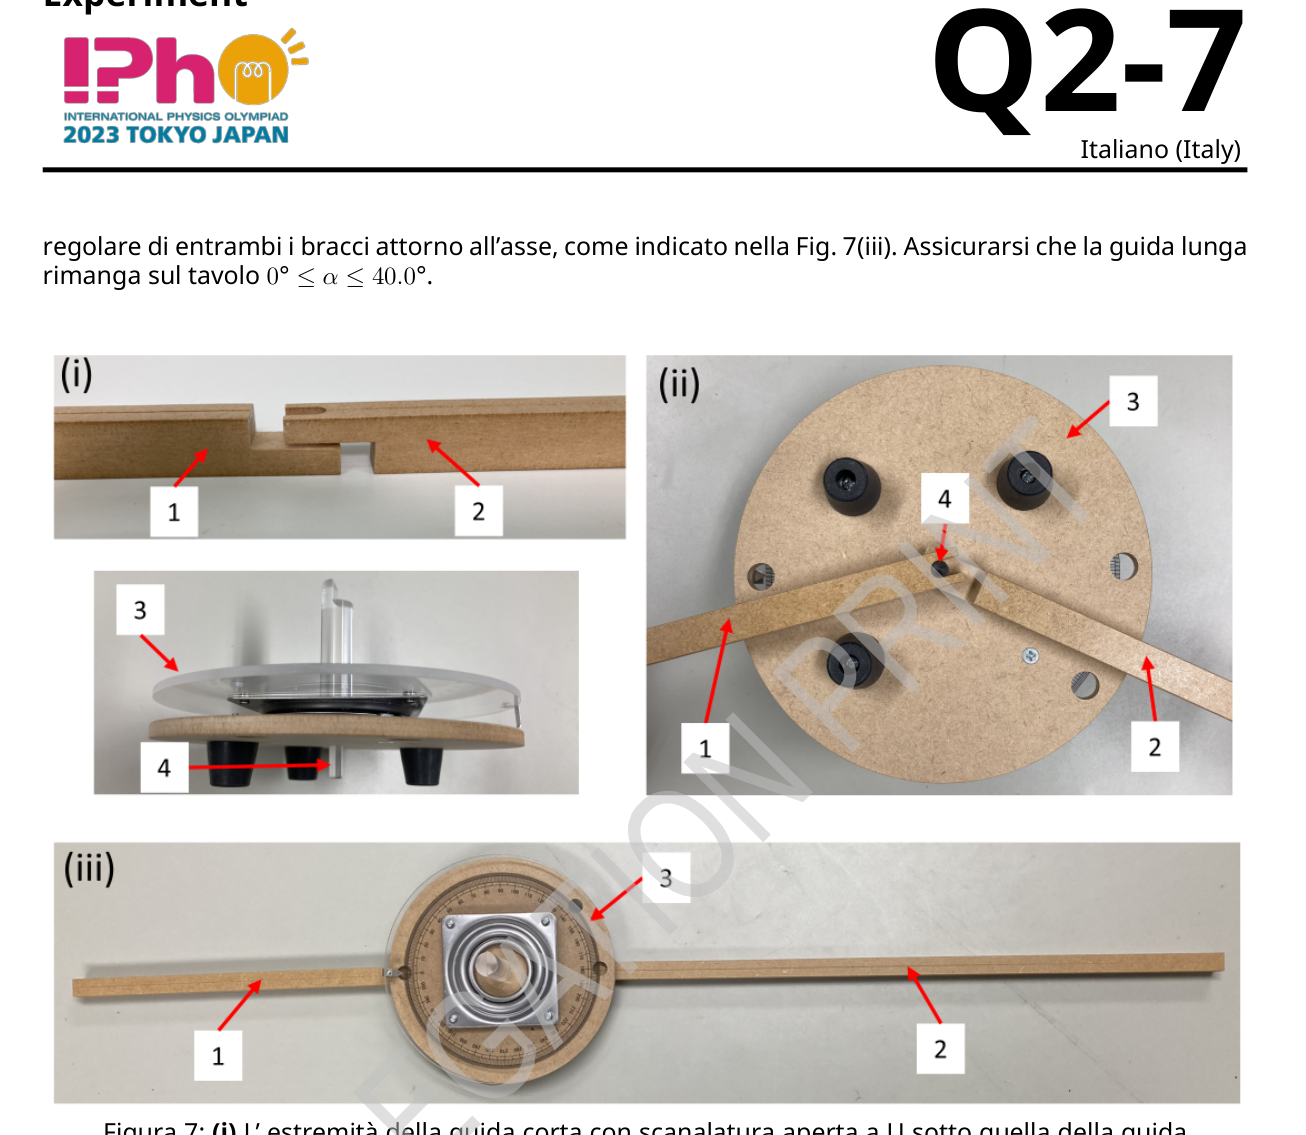
Di seguito utilizziamo e l’angolo di diffrazione viene fissato a . Figura 6: L’angolo di rotazione del reticolo di diffrazione in trasmissione G e l’angolo di diffrazione . A.1 Calcolare la lunghezza d’onda massima che può essere misurata e il relativo . 0.3 pt A.2 Calcolare il valore numerico di per nm. 0.2 pt Le procedure di impostazione del sistema di misura sono le seguenti. [1] Posizionare verticalmente lo schermo con carta millimetrata (17 nella Fig. 5) utilizzando il piedistallo (17(b)). [2] Posizionare due batterie sul modulo LED bianco. Le parti ”+” devono essere rivolte verso di voi. [3] Accendere il LED. [4] Rimuovere la vite sul lato anteriore del modulo LED. Fissare la fenditura al modulo LED con la vite (4 nella Fig. 4). Utilizzando lo schermo con carta millimetrata, regolare la posizione della fenditura in modo che il flusso di luce bianca trasmesso sia il più luminoso possibile e misurare l’altezza del centro del fascio all’uscita della fenditura (per la procedura [9]). [5] Fare in modo che l’estremità a forma di U con scanalatura aperta della guida lunga si appoggi a quella della guida corta (Fig. 7(i)). Inserire l’asse di rotazione che fuoriesce dalla faccia inferiore della piattaforma di rotazione nel ”foro passante virtuale” creato dalle guide (Fig. 7(ii)). Assicurare una rotazione libera e Experiment Q2-7 Italiano (Italy) regolare di entrambi i bracci attorno all’asse, come indicato nella Fig. 7(iii). Assicurarsi che la guida lunga rimanga sul tavolo . Figura 7: (i) L’ estremità della guida corta con scanalatura aperta a U sotto quella della guida lunga crea un foro passante ”virtuale”. (ii) Nel foro virtuale, inserire l’asse che fuoriesce dalla faccia inferiore della piattaforma di rotazione. (iii) Vista dall’alto della piattaforma di rotazione con le guide libere di ruotare attorno all’asse. 1. guida corta; 2. guida lunga; 3. piattaforma di rotazione; 4. asse della piattaforma rotazione. [6] Allineare la linea centrale della guida corta con sulla scala della piattaforma di rotazione e mantenerla in tale posizione. È possibile collocare un foglio antiscivolo sotto la guida corta. [7] Assemblare le lenti (5 in Fig. 4). [8] Posizionare il modulo LED bianco con la fenditura e la lente (L1 nella Fig. 3) sulla guida corta. Regolare la distanza tra la fenditura e L1 in modo che la dimensione del fascio di luce, dopo aver attraversato L1, rimanga pressoché costante, cioè collimata, lungo il percorso della luce. [9] Utilizzando lo schermo con carta millimetrata, misurare l’altezza del fascio dopo L1. Regolare il livello di L1 allentando la vite di fermo della base del montante e spostando il montante quanto necessario per mantenere l’altezza del fascio quasi uguale a quella subito dopo la fenditura. [10] Allineare la linea centrale della guida lunga con i della scala angolare sulla piattaforma di rotazione. [11] Modificare la posizione orizzontale del supporto dell’obiettivo (5(a) nella Fig. 4) allentando la vite di fermo e spostandolo a destra o a sinistra. Il centro del fascio dopo L1 dovrebbe allinearsi con la linea Experiment Q2-8 Italiano (Italy) centrale della guida lunga. È possibile posizionare lo schermo con carta millimetrata capovolto sulla guida lunga. [12] Attaccare la seconda superficie del nastro biadesivo sul lato posteriore del reticolo di diffrazione a trasmissione (6(b) nella Fig. 4) e fissarlo all’asse superiore della piattaforma di rotazione (6 nella Fig. 4). [13] Rivolgere il lato anteriore del reticolo verso la sorgente luminosa e ruotare la piattaforma in modo che la luce riflessa entri nella fenditura, cioè (incidenza normale). Annotare l’angolo della piattaforma di rotazione. Sarà utilizzato nella domanda B.1. [14] Spostare la guida lunga intorno all’asse in modo che (Fig. 6). Una volta fissata, è possibile posizionare successivamente un secondo foglio antiscivolo per evitare disallineamenti accidentali. [15] Posizionare la lente (L2 nella Fig. 3) e il fotorivelatore (PD nella Fig. 3) con il supporto cilindrico sulla guida lunga. Per focalizzare la luce diffratta su PD, regolare la distanza tra PD e L2 lungo la guida lunga e l’altezza di L2. L’ampiezza verticale del fascio viene così ridotta al minimo. Controllare l’ampiezza del fascio con il cartoncino bianco. Nel caso in cui sia troppo debole per essere riconosciuto a occhio nudo, utilizzare la scatola di schermatura per coprire PD. [16] Applicare il cilindro paraluce al supporto (13 nella Fig. 5). Lo schermo luminoso riduce al minimo la luce indesiderata da rilevare. [17] Collegare il PD al DMM. Il filo rosso (nero) va al terminale rosso (nero). Impostare il multimetro sulla modalità di misurazione della tensione continua (DC). [18] Regolare l’altezza di L2 per massimizzare le letture del DMM. Di seguito, l’intensità della luce è identificata con i valori di tensione sul DMM. A.3 Ruotare la piattaforma di rotazione e trovare l’angolo e la corrispondente lunghezza d’onda alla quale la densità spettrale di emissione del LED blu è massima, assumendo che . Se la risposta ottenuta è compresa tra 450 e 460 nm, l’apparato è correttamente allineato; scrivere sul foglio delle risposte e continuare. Altrimenti, si dovrà trovare il vero valore di . Senza cambiare nulla, compreso il valore originale di trovato, determinare un valore corretto per cui ricada nell’intervallo appropriato. Registrare qu
p.1 — Scomposizione vettoriale del campo elettrico
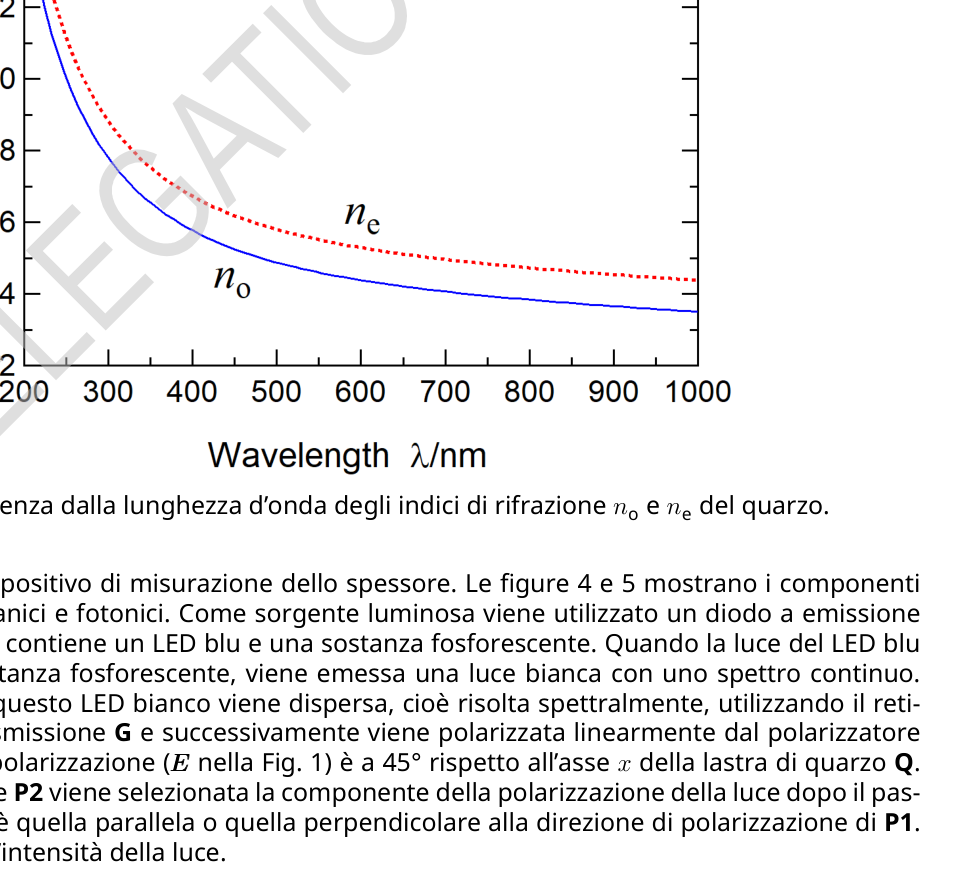
p.2 — Indice di rifrazione del quarzo vs lunghezza d’onda
p.3 — Schema e fotografia del dispositivo di misura
p.4 — Componenti e dispositivi del montaggio
p.5 — Componenti e dispositivi (continua)
p.6 — Geometria diffrazione LED reticolo fotorilevatore
Topic: Wave Optics, Geometric Optics Metodi: Interference & Diffraction Analysis, Snell’s Law, Experimental Data Analysis Competenze: Experimental Data Analysis, Mathematical Modeling, Measurement & Instrumentation Objects: Slit, Lens, Diffraction Grating, Screen Fonte: Testo (PDF) — p.2 Soluzione: Soluzioni (PDF)
P1. The direction of its polarization ( in Fig. 1) is with respect to the axis of the Q quartz plate. By rotating the polarizer P2, the component of the polarization of light after passing through Q, i.e. that parallel or perpendicular to the polarization direction of P1 is selected. The light elevator measures the intensity of light. Experiments Q2-3 Italian (Italy) Figure 3: (a) Schedule and (b) Photograph of the thickness measuring device. The following is the list of the categories of products: White, S: crack, L1: contact lens, G: transmission diffraction lattice, P1: polarizer, Q: quartz plate, P2: polarizer, L2: focusing lens, C: cylinder of The Commission has decided to adopt a decision on the conclusion of the Agreement on the European Economic Area. Experiments Q2-4 Italian (Italy) Figure 4: Components and devices: 1(a). White LED (frontal view); 1(b) White LED (rear view); 2. batteries; 3. The following table shows the results of the study: 3); 4. LED with attached slit; 5. Lenses (L1, L2 in
- What? 3); 5* (a) lens mounted; 5* (b) lens support; 5* (c) base of support; 6. Transmission diffraction lattice (6(a) front; 6(b) rear with adhesive tape) on 6(c) platform The following table shows the results of the calculations: 3); 6 (d) angle reading device on the rotating platform; 7. The polarizer (P1 in Fig. 3); 8. Quartz plate (Q in Fig. 3); 9. The vehicle shall be equipped with a brake pad. The rotation rate (P2 in Fig. 3). Experiments Q2-5 Italian (Italy) Figure 5: Components and devices (continuous): 10. a magnetic light protection cylinder (C to Fig. 3); 11. cylinder support; 12. The Commission has also adopted a number of proposals for the 3); 13. The following table shows the cylinder; 14. The number of units in the digital multimeter (DMM in Fig. 3); 15. short drive; 16. The length of the vehicle is 17. screen with millimeter paper; 18. white card; 19. the black card; 20. The following table shows the results of the analysis: Light protection box (before installation and how it is installed). Experiments Q2-6 Italian (Italy) Part A. The measuring system setting (2.3 points) The light coming out of the LED is incident on the surface of the lattice (Fig. 6). The rotation angle of G for The normal incidence is set to . The time-to-time and off-time rotations shall be indicated respectively with + and . The angle of diffraction in the first order is defined as shown. Indicating the step with of the drainage (i.e. the distance between the cracks) of G, the wavelength is given in terms of as
The following is used and the diffraction angle is set to . Figure 6: The rotation angle of the transmission diffraction lattice G and the angle of diffrazione . A.1 Calculate the maximum wavelength that can be measured and the relative . 0.3 pt A.2 Calculate the numerical value of for nm. 0.2 pt The procedures for setting up the measuring system are as follows. [1] Position the screen vertically with millimeter paper (17 in Fig. 5) using the pedestal (17(b)). [2] Place two batteries on the white LED module. The parts + must be directed at you. [3] Turn on the LED. [4] Remove the screw on the front of the LED module. Fix the crack to the LED module with the screw (4 in Fig. 4). Using the millimeter paper screen, adjust the position of the crack so that The white light transmitted shall be as bright as possible and the height of the centre of the beam shall be measured. the clearance of the cleft (for the procedure [9]). [5] Make the U-shaped end with open drainage of the long drive leaning against the The short-range driving (Fig. 7(i)). Insert the rotating axis that exits the lower side of the platform The rotation of the virtual passing beam created by the guides (Fig. 7(ii)). Ensure free movement and Experiments Q2-7 Italian (Italy) adjust both arms around the axis, as shown in Fig. 7 (iii) Make sure the long drive remain on the table . Figure 7: (i) The end of the short drive with the opening channel at U below the drive The long-term effect is to create a virtual through hole. (ii) In the virtual forum, insert the axis that leaves the the lower face of the rotating platform. (iii) Viewed from the top of the rotating platform With the guides free to rotate around the axis. 1. short drive; 2. long-distance driving; 3. the platform of rotation; 4. the axis of the rotating platform. [6] Align the centre of the short drive with on the rotating platform scale and keep it in that position. It is possible to place a slip sheet under the short guide. [7] Assembling the lenses (5 in Fig. 4). [8] Position the white LED module with the split and lens (L1 in Fig. 3) on short driving. The rules the distance between the cleft and L1 so that the beam size, after crossing L1, It remains almost constant, that is, colliding, along the path of light. [9] Using the millimeter paper screen, measure the beam height after L1. Adjusting the level L1 by loosening the stop-crank of the base of the lift and moving the lift as necessary to The height of the beam should be kept almost the same as the one immediately after the split. [10] Align the centre line of the long drive with the of the angle scale on the platform of the The rotation. [11] Change the horizontal position of the support for the target (5(a) in Fig. 4) easing the lives of I’m going to stop and move it to the right or to the left. The center of the beam after L1 should align with the line Experiments Q2-8 Italian (Italy) The central part of the long drive. You can place the screen with the millimeter paper backwards on the It’s a long drive. [12] Attach the second surface of the biadhesive tape to the rear of the diffraction lattice to The Commission has also adopted a proposal for a regulation on the protection of the environment. 4) and attach it to the upper axis of the rotating platform (6 in Fig. 4). [13] Turn the front of the lattice towards the light source and rotate the platform so that The reflected light enters the cleft, i.e. (normal incidence). Note the angle of the The rotating platform. It will be used in application B.1. [14] Move the long wheel around the axle so that (Fig. 6). Once fixed, it is possible to a second anti-slip sheet shall be placed afterwards to avoid accidental misalignment. [15] Position the lens (L2 in Fig. The photoreflector (PD in Fig. 3) is used to measure the light output of the device. 3) with the cylindrical support on the It’s a long drive. To focus diffracted light on PD, adjust the distance between PD and L2 along the long drive and the height of L2. The vertical width of the beam is thus reduced to a minimum. Check the width of the I’ll put it on the white card. In case it’s too weak to be recognized with the naked eye, Use the shield box to cover PD. The cylinder is a small cylinder with a diameter of about 10 mm. 5). The light screen shall minimise the unwanted light to detect. [17] Link the PD to the DMM. The red (black) wire goes to the red (black) terminal. Set the multimeter to The measurement method for continuous voltage (DC). [18] Adjust the L2 height to maximize DMM readings. The intensity of light is identified with the voltage values on the DMM. A.3 Rotate the rotating platform and find the angle and the corresponding wavelength at which the spectral emission density of the blue LED is maximum, assuming that . If the resulting response is between 450 and 460 nm, the apparatus is properly aligned; write on the sheet of the I’ll answer and go on. Otherwise, the true value of must be found. Without changing anything, including the original value of found, determine a value corrected so that falls within the appropriate range. Record this
p.1 — Scomposizione vettoriale del campo elettrico
p.2 — Indice di rifrazione del quarzo vs lunghezza d’onda
p.3 Scheme and photograph of the measuring device
**p.4 ** Assembly components and devices
p.5 — Componenti e dispositivi (continua)
p.6 — Geometria diffrazione LED reticolo fotorilevatore
Topic: Wave Optics, Geometric Optics Metodi: Interference & Diffraction Analysis, Snell’s Law, Experimental Data Analysis Competenze: Experimental Data Analysis, Mathematical Modeling, Measurement & Instrumentation Objects: Slit, Lens, Diffraction Grating, Screen Fonte: Testo (PDF) — p.2 Soluzione: Soluzioni (PDF)
P2 tale per cui la sua direzione di polarizzazione sia perpendicolare a quella della luce trasmessa attraverso il polarizzatore P1. Da questo risultato, trovare l’angolo del supporto di rotazione del polarizzatore P2 quando la sua direzione di polarizzazione è parallela a quella del polarizzatore P1. 0.3 pt A.5 Bloccare la luce attraverso la fenditura ponendo il cartoncino nero davanti alla fenditura. In questo modo è possibile valutare il rumore di fondo del sistema, cioè l’offset dell’intensità dallo zero. Definiamo le intensità luminose e quando gli angoli del supporto di rotazione del polarizzatore P2 sono rispettivamente e . Misurare gli offset e . Si noti che e sono dovuti a luce diversa da quella della sorgente luminosa. Questi valori devono essere eliminati per sottrazione per determinare il solo contributo della sorgente luminosa. 0.2 pt Experiment Q2-9 Italiano (Italy) A.6 e si riferiscono alle intensità luminose della sorgente luminosa quando gli angoli del supporto di rotazione del polarizzatore P2 sono rispettivamente e . Misurare le intensità luminose e per . 0.5 pt Parte B. Misurazione dell’intensità della luce trasmessa (4.7 punti) Di seguito, utilizzare i valori di calcolati utilizzando il valore corretto di in A.3, se necessario. B.1 Posizionare la lastra di quarzo tra i polarizzatori P1 e P2 e misurare le intensità della luce trasmessa e a vari angoli . Le misure devono coprire completamente l’intervallo di lunghezze d’onda da 440 nm a 660 nm. Tabulare i seguenti parametri: (letture dell’angolo dello strumento di rotazione), , , , , , . Si noti che quando il valore di aumenta, il valore di diminuisce della stessa quantità e viceversa. Non è necessario utilizzare tutte le righe della tabella fornita, ma è opportuno prendere abbastanza dati per ottenere risultati accurati. 2.0 pt B.2 Disegnare sul grafico lo spettro del LED bianco, cioè in funzione della lunghezza d’onda. 1.0 pt B.3 Trovare , cioè la larghezza a metà altezza dello spettro del LED blu incorporato nel LED bianco. Essa è la larghezza di un picco misurata tra i punti che si trovano a metà dell’intensità massima. 0.2 pt B.4 Disegnare sul grafico lo spettro di . 1.5 pt Parte C. Analisi delle misure (3.0 punti) C.1 Dal grafico , trovare tutte le lunghezze d’onda alle quali le intensità passano attraverso minimi locali. Il numero d’ordine associato secondo l’Eq. (6) deve essere indicato sotto la lunghezza d’onda corrispondente. Per determinare la birifrangenza , utilizzare i valori di e indicati nella Tabella 1. 1.5 pt C.2 Ottenere lo spessore del campione L. 1.5 pt Experiment Q2-10 Italiano (Italy) Tabella 1: Indici di rifrazione e del quarzo (400-700 nm). λ/nm no ne λ/nm no ne λ/nm no ne 400 1.55769 1.56725 434 1.55394 1.56337 467 1.55107 1.56041 401 1.55756 1.56712 435 1.55384 1.56327 468 1.55099 1.56033 402 1.55744 1.56700 436 1.55374 1.56318 469 1.55091 1.56025 403 1.55732 1.56687 437 1.55365 1.56308 470 1.55084 1.56017 404 1.55720 1.56674 438 1.55355 1.56298 471 1.55076 1.56009 405 1.55707 1.56662 439 1.55346 1.56288 472 1.55068 1.56001 406 1.55695 1.56649 440 1.55337 1.56278 473 1.55061 1.55993 407 1.55684 1.56637 441 1.55327 1.56269 474 1.55054 1.55986 408 1.55672 1.56625 442 1.55318 1.56259 475 1.55046 1.55978 409 1.55660 1.56613 443 1.55309 1.56250 476 1.55039 1.55970 410 1.55648 1.56601 444 1.55300 1.56240 477 1.55031 1.55963 411 1.55637 1.56589 445 1.55291 1.56231 478 1.55024 1.55955 412 1.55625 1.56577 446 1.55282 1.56222 479 1.55017 1.55948 413 1.55614 1.56565 447 1.55273 1.56213 480 1.55010 1.55940 414 1.55603 1.56554 448 1.55264 1.56203 481 1.55003 1.55933 415 1.55592 1.56542 449 1.55255 1.56194 482 1.54995 1.55926 416 1.55580 1.56531 450 1.55247 1.56185 483 1.54988 1.55918 417 1.55569 1.56519 451 1.55238 1.56176 484 1.54981 1.55911 418 1.55558 1.56508 452 1.55229 1.56167 485 1.54974 1.55904 419 1.55548 1.56497 453 1.55221 1.56159 486 1.54967 1.55897 420 1.55537 1.56485 454 1.55212 1.56150 487 1.54961 1.55890 421 1.55526 1.56474 455 1.55204 1.56141 488 1.54954 1.55883 422 1.55515 1.56463 456 1.55195 1.56132 489 1.54947 1.55875 423 1.55505 1.56452 457 1.55187 1.56124 490 1.54940 1.55868 424 1.55494 1.56442 458 1.55179 1.56115 491 1.54933 1.55862 425 1.55484 1.56431 459 1.55171 1.56107 492 1.54927 1.55855 426 1.55474 1.56420 460 1.55162 1.56098 493 1.54920 1.55848 427 1.55463 1.56410 461 1.55154 1.56090 494 1.54913 1.55841 428 1.55453 1.56399 462 1.55146 1.56082 495 1.54907 1.55834 429 1.55443 1.56389 463 1.55138 1.56073 496 1.54900 1.55827 430 1.55433 1.56378 464 1.55130 1.56065 497 1.54894 1.55821 431 1.55423 1.56368 465 1.55122 1.56057 498 1.54887 1.55814 432 1.55413 1.56358 466 1.55115 1.56049 499 1.54881 1.55807 433 1.55403 1.56348 Experiment Q2-11 Italiano (Italy) λ/nm no ne λ/nm no ne λ/nm no ne 500 1.54875 1.55801 534 1.54678 1.55597 567 1.54518 1.55432 501 1.54868 1.55794 535 1.54673 1.55592 568 1.54514 1.55427 502 1.54862 1.55788 536 1.54667 1.55587 569 1.54509 1.55423 503 1.54856 1.55781 537 1.54662 1.55581 570 1.54505 1.55418 504 1.54850 1.55775 538 1.54657 1.55576 571 1.54500 1.55414 505 1.54843 1.55768 539 1.54652 1.55570 572 1.54496 1.55409 506 1.54837 1.55762 540 1.54647 1.55565 573 1.54492 1.55405 507 1.54831 1.55756 541 1.54642 1.55560 574 1.54487 1.55400 508 1.54825 1.55749 542 1.54637 1.55555 575 1.54483 1.55396 509 1.54819 1.55743 543 1.54632 1.55549 576 1.54479 1.55391 510 1.54813 1.55737 544 1.54627 1.55544 577 1.54474 1.55387 511 1.54807 1.55731 545 1.54622 1.55539 578 1.54470 1.55383 512 1.54801 1.55725 546 1.54617 1.55534 579 1.54466 1.55378 513 1.54795 1.55718 547 1.54612 1.55529 580 1.54462 1.55374 514 1.54789 1.55712 548 1.54607 1.55524 581 1.54458 1.55370 515 1.54783 1.55706 549 1.54602 1.55519 582 1.54453 1.55365 516 1.54777 1.55700 550 1.54597 1.55514 583 1.54449 1.55361 517 1.54772 1.55694 551 1.54592 1.55509 584 1.54445 1.55357 518 1.54766 1.55688 552 1.54587 1.55504 585 1.54441 1.55352 519 1.54760 1.55682 553 1.54583 1.55499 586 1.54437 1.55348 520 1.54754 1.55676 554 1.54578 1.55494 587 1.54433 1.55344 521 1.54749 1.55671 555 1.54573 1.55489 588 1.54429 1.55340 522 1.54743 1.55665 556 1.54568 1.55484 589 1.54425 1.55336 523 1.54738 1.55659 557 1.54564 1.55479 590 1.54421 1.55331 524 1.54732 1.55653 558 1.54559 1.55474 591 1.54417 1.55327 525 1.54726 1.55648 559 1.54554 1.55470 592 1.54413 1.55323 526 1.54721 1.55642 560 1.54550 1.55465 593 1.54409 1.55319 527 1.54715 1.55636 561 1.54545 1.55460 594 1.54405 1.55315 528 1.54710 1.55631 562 1.54541 1.55455 595 1.54401 1.55311 529 1.54705 1.55625 563 1.54536 1.55451 596 1.54397 1.55307 530 1.54699 1.55619 564 1.54531 1.55446 597 1.54393 1.55303 531 1.54694 1.55614 565 1.54527 1.55441 598 1.54389 1.55299 532 1.54688 1.55608 566 1.54522 1.55437 599 1.54385 1.55295 533 1.54683 1.55603 Experiment Q2-12 Italiano (Italy) λ/nm no ne λ/nm no ne λ/nm no ne 600 1.54382 1.55291 634 1.54260 1.55165 667 1.54157 1.55059 601 1.54378 1.55287 635 1.54257 1.55162 668 1.54154 1.55056 602 1.54374 1.55283 636 1.54254 1.55159 669 1.54151 1.55053 603 1.54370 1.55279 637 1.54250 1.55155 670 1.54148 1.55050 604 1.54366 1.55275 638 1.54247 1.55152 671 1.54145 1.55047 605 1.54363 1.55271 639 1.54244 1.55148 672 1.54143 1.55044 606 1.54359 1.55267 640 1.54241 1.55145 673 1.54140 1.55041 607 1.54355 1.55264 641 1.54237 1.55142 674 1.54137 1.55038 608 1.54351 1.55260 642 1.54234 1.55138 675 1.54134 1.55035 609 1.54348 1.55256 643 1.54231 1.55135 676 1.54131 1.55032 610 1.54344 1.55252 644 1.54228 1.55132 677 1.54128 1.55029 611 1.54340 1.55248 645 1.54224 1.55128 678 1.54125 1.55026 612 1.54337 1.55245 646 1.54221 1.55125 679 1.54123 1.55023 613 1.54333 1.55241 647 1.54218 1.55122 680 1.54120 1.55020 614 1.54330 1.55237 648 1.54215 1.55119 681 1.54117 1.55017 615 1.54326 1.55233 649 1.54212 1.55115 682 1.54114 1.55014
p.7 — Montaggio piattaforma di rotazione e guida
Topic: Wave Optics, Geometric Optics, Oscillations & Waves Metodi: Interference & Diffraction Analysis, Experimental Data Analysis, Superposition Principle Competenze: Experimental Data Analysis, Graph Linearization, Measurement & Instrumentation Objects: Diffraction Grating Fonte: Testo (PDF) — p.8 Soluzione: Soluzioni (PDF)
P2 such that its direction of polarization is perpendicular to that of the light transmitted through the polarizer P1. From this result, find the angle of the rotary support of the polarizer P2 when its direction is The polarization is parallel to that of the polarizer P1. 0.3 pt A.5 Block the light through the crack by placing the black cardboard in front of the The cracking. This way you can evaluate the background noise of the system, This is the offset of the zero intensity. We define the light intensities and when the angles of the rotary support of the polarizer P2 are rispettivamente e . Measure the offsets and . Please note that and are due to light different from that of the light source. These values must be deleted by subtraction to determine only the contribution from the light source. 0.2 pt Experiments Q2-9 Italian (Italy) A.6 and refer to the light intensities of the light source when the light source is The angles of the rotary support of the polarizer P2 shall be respectively. e . The light intensities and shall be measured for . 0.5 pt Part B. Measurement of the intensity of the light transmitted (4.7 points) Next, use the values of calculated using the correct value of in A.3, if necessary. B.1 Place the quartz plate between the polarizers P1 and P2 and measure the intensities of light transmitted and at various angles . The measures shall cover: The wavelength range from 440 nm to 660 nm is completely Table the following parameters: (angle readings of the rotating instrument), , , , , , . Note that when the value of The value of decreases by the same amount and vice versa. It is not necessary to use all the rows in the table provided, but it is appropriate to take the following steps: enough data to get accurate results. 2.0 pt B.2 Draw the spectrum of the white LED on the graph, i.e. depending on the The length of the wave. 1.0 pt B.3 Find , that is, the width to half-height of the spectrum of the blue LED embedded in the white LED. It is the width of a peak measured between the points The maximum intensity of the gas is about half that of the maximum intensity. 0.2 pt B.4 Draw the spectrum of on the graph. 1.5 pt Part C. Analysis of the measures (3.0 points) C.1 From the graph, find all the wavelengths at which the intensities pass through local minima. The associated order number according to the equation. (6) The corresponding wavelength shall be indicated below. To determine the the bifrange , use the values of and as shown in Table 1. 1.5 pt C.2 Get the thickness of the L sample. 1.5 pt Experiments Q2-10 Italian (Italy) Table 1: Quartz refractive indices and (400-700 nm). λ/nm no ne λ/nm no ne λ/nm no ne 400 1.55769 1.56725 434 1.55394 1.56337 467 1.55107 1.56041 401 1.55756 1.56712 435 1.55384 1.56327 468 1.55099 1.56033 402 1.55744 1.56700 436 1.55374 1.56318 469 1.55091 1.56025 403 1.55732 1.56687 437 1.55365 1.56308 470 1.55084 1.56017 404 1.55720 1.56674 438 1.55355 1.56298 471 1.55076 1.56009 405 1.55707 1.56662 439 1.55346 1.56288 472 1.55068 1.56001 406 1.55695 1.56649 440 1.55337 1.56278 473 1.55061 1.55993 407 1.55684 1.56637 441 1.55327 1.56269 474 1.55054 1.55986 408 1.55672 1.56625 442 1.55318 1.56259 475 1.55046 1.55978 409 1.55660 1.56613 443 1.55309 1.56250 476 1.55039 1.55970 410 1.55648 1.56601 444 1.55300 1.56240 477 1.55031 1.55963 411 1.55637 1.56589 445 1.55291 1.56231 478 1.55024 1.55955 412 1.55625 1.56577 446 1.55282 1.56222 479 1.55017 1.55948 413 1.55614 1.56565 447 1.55273 1.56213 480 1.55010 1.55940 414 1.55603 1.56554 448 1.55264 1.56203 481 1.55003 1.55933 415 1.55592 1.56542 449 1.55255 1.56194 482 1.54995 1.55926 416 1.55580 1.56531 450 1.55247 1.56185 483 1.54988 1.55918 417 1.55569 1.56519 451 1.55238 1.56176 484 1.54981 1.55911 418 1.55558 1.56508 452 1.55229 1.56167 485 1.54974 1.55904 419 1.55548 1.56497 453 1.55221 1.56159 486 1.54967 1.55897 420 1.55537 1.56485 454 1.55212 1.56150 487 1.54961 1.55890 421 1.55526 1.56474 455 1.55204 1.56141 488 1.54954 1.55883 422 1.55515 1.56463 456 1.55195 1.56132 489 1.54947 1.55875 423 1.55505 1.56452 457 1.55187 1.56124 490 1.54940 1.55868 424 1.55494 1.56442 458 1.55179 1.56115 491 1.54933 1.55862 425 1.55484 1.56431 459 1.55171 1.56107 492 1.54927 1.55855 426 1.55474 1.56420 460 1.55162 1.56098 493 1.54920 1.55848 427 1.55463 1.56410 461 1.55154 1.56090 494 1.54913 1.55841 428 1.55453 1.56399 462 1.55146 1.56082 495 1.54907 1.55834 429 1.55443 1.56389 463 1.55138 1.56073 496 1.54900 1.55827 430 1.55433 1.56378 464 1.55130 1.56065 497 1.54894 1.55821 431 1.55423 1.56368 465 1.55122 1.56057 498 1.54887 1.55814 432 1.55413 1.56358 466 1.55115 1.56049 499 1.54881 1.55807 433 1.55403 1.56348 Experiments Q2-11 Italian (Italy) λ/nm no ne λ/nm no ne λ/nm no ne 500 1.54875 1.55801 534 1.54678 1.55597 567 1.54518 1.55432 501 1.54868 1.55794 535 1.54673 1.55592 568 1.54514 1.55427 502 1.54862 1.55788 536 1.54667 1.55587 569 1.54509 1.55423 503 1.54856 1.55781 537 1.54662 1.55581 570 1.54505 1.55418 504 1.54850 1.55775 538 1.54657 1.55576 571 1.54500 1.55414 505 1.54843 1.55768 539 1.54652 1.55570 572 1.54496 1.55409 506 1.54837 1.55762 540 1.54647 1.55565 573 1.54492 1.55405 507 1.54831 1.55756 541 1.54642 1.55560 574 1.54487 1.55400 508 1.54825 1.55749 542 1.54637 1.55555 575 1.54483 1.55396 509 1.54819 1.55743 543 1.54632 1.55549 576 1.54479 1.55391 510 1.54813 1.55737 544 1.54627 1.55544 577 1.54474 1.55387 511 1.54807 1.55731 545 1.54622 1.55539 578 1.54470 1.55383 512 1.54801 1.55725 546 1.54617 1.55534 579 1.54466 1.55378 513 1.54795 1.55718 547 1.54612 1.55529 580 1.54462 1.55374 514 1.54789 1.55712 548 1.54607 1.55524 581 1.54458 1.55370 515 1.54783 1.55706 549 1.54602 1.55519 582 1.54453 1.55365 516 1.54777 1.55700 550 1.54597 1.55514 583 1.54449 1.55361 517 1.54772 1.55694 551 1.54592 1.55509 584 1.54445 1.55357 518 1.54766 1.55688 552 1.54587 1.55504 585 1.54441 1.55352 519 1.54760 1.55682 553 1.54583 1.55499 586 1.54437 1.55348 520 1.54754 1.55676 554 1.54578 1.55494 587 1.54433 1.55344 521 1.54749 1.55671 555 1.54573 1.55489 588 1.54429 1.55340 522 1.54743 1.55665 556 1.54568 1.55484 589 1.54425 1.55336 523 1.54738 1.55659 557 1.54564 1.55479 590 1.54421 1.55331 524 1.54732 1.55653 558 1.54559 1.55474 591 1.54417 1.55327 525 1.54726 1.55648 559 1.54554 1.55470 592 1.54413 1.55323 526 1.54721 1.55642 560 1.54550 1.55465 593 1.54409 1.55319 527 1.54715 1.55636 561 1.54545 1.55460 594 1.54405 1.55315 528 1.54710 1.55631 562 1.54541 1.55455 595 1.54401 1.55311 529 1.54705 1.55625 563 1.54536 1.55451 596 1.54397 1.55307 530 1.54699 1.55619 564 1.54531 1.55446 597 1.54393 1.55303 531 1.54694 1.55614 565 1.54527 1.55441 598 1.54389 1.55299 532 1.54688 1.55608 566 1.54522 1.55437 599 1.54385 1.55295 533 1.54683 1.55603 Experiments Q2-12 Italian (Italy) λ/nm no ne λ/nm no ne λ/nm no ne 600 1.54382 1.55291 634 1.54260 1.55165 667 1.54157 1.55059 601 1.54378 1.55287 635 1.54257 1.55162 668 1.54154 1.55056 602 1.54374 1.55283 636 1.54254 1.55159 669 1.54151 1.55053 603 1.54370 1.55279 637 1.54250 1.55155 670 1.54148 1.55050 604 1.54366 1.55275 638 1.54247 1.55152 671 1.54145 1.55047 605 1.54363 1.55271 639 1.54244 1.55148 672 1.54143 1.55044 606 1.54359 1.55267 640 1.54241 1.55145 673 1.54140 1.55041 607 1.54355 1.55264 641 1.54237 1.55142 674 1.54137 1.55038 608 1.54351 1.55260 642 1.54234 1.55138 675 1.54134 1.55035 609 1.54348 1.55256 643 1.54231 1.55135 676 1.54131 1.55032 610 1.54344 1.55252 644 1.54228 1.55132 677 1.54128 1.55029 611 1.54340 1.55248 645 1.54224 1.55128 678 1.54125 1.55026 612 1.54337 1.55245 646 1.54221 1.55125 679 1.54123 1.55023 613 1.54333 1.55241 647 1.54218 1.55122 680 1.54120 1.55020 614 1.54330 1.55237 648 1.54215 1.55119 681 1.54117 1.55017 615 1.54326 1.55233 649 1.54212 1.55115 682 1.54114 1.55014
p.7 — Montaggio piattaforma di rotazione e guida
Topic: Wave Optics, Geometric Optics, Oscillations & Waves Metodi: Interference & Diffraction Analysis, Experimental Data Analysis, Superposition Principle Competenze: Experimental Data Analysis, Graph Linearization, Measurement & Instrumentation Objects: Diffraction Grating Fonte: Testo (PDF) — p.8 Soluzione: Soluzioni (PDF)