We can represent phases of the Moon diagramatically as follows:
Quesito 1

It is known that there would be a new moon day on 28th February 2025. Sameer, who is writing a science fiction story, visualised various hypothetical situations for the phases of Moon during the month of March 2025. For each of the cases described below, draw the phases of Moon as it will appear on 3rd March, 8th March, 11th March, 15th March, 20th March and 27th March. High precision diagrams are not expected. Any approximate drawings (like the ones shown above) will be accepted.
(a) [4] First he thought that the lead character of his novel should be a resident of the Moon and she can see the Earth in her sky. Draw phases of Earth as seen by her.
(b) [4] As he did not find first case interesting enough, he brought his leading lady back to the Earth. Next he assumed that the orbit of Moon around Earth is perpendicular (inclination ) to the orbit of Earth around the Sun (i.e. ecliptic plane) and the normal to the orbit is always towards the Sun. Draw phases of the Moon in this case.
(c) [4] Lastly, he assumed the orbit of the Moon is in the ecliptic plane (inclination ), but the shape of the Moon is cylindrical, with the diameter of the cylinder being equal to its height. The axis of the cylinder is perpendicular to the ecliptic plane. For the observer based on Earth, draw the phases of the Moon.
Topic: Astrophysics, Gravitation Metodi: Physical Modeling Competenze: Diagrammatic Reasoning Objects: Satellite, Planet, Star Fonte: Testo (PDF) — p.2 Soluzione: Soluzioni (PDF)
Possiamo rappresentare le fasi della Luna in modo diagrammatico come segue:
Quesito 1
È noto che ci sarà un giorno di luna nuova il 28 febbraio 2025. Sameer, che sta scrivendo una storia di fantascienza, ha visualizzato varie situazioni ipotetiche per le fasi della Luna durante il mese di marzo 2025. Per ciascuno dei casi descritti di seguito, disegnare le fasi della Luna come apparirà il 3 marzo, 8 marzo, 11 marzo, 15 marzo, 20 marzo e 27 marzo. Non si aspettano diagrammi di alta precisione. Sono accettati tutti i disegni approssimativi (come quelli mostrati sopra).
(a) [4] All’inizio pensò che il personaggio principale del suo romanzo debba essere un residente della Luna e che potesse vedere la Terra nel suo cielo. Disegna le fasi della Terra come lei le vede.
(b) [4] Poiché non trovò il primo caso abbastanza interessante, riportò la sua protagonista sulla Terra. Successivamente ha ipotizzato che l’orbita della Luna attorno alla Terra sia perpendicolare (inclinazione ) all’orbita della Terra attorno al Sole (cioè L’orbita è sempre orientata verso il Sole. Disegna le fasi della Luna in questo caso.
(c) [4] Infine, ha supposto che l’orbita della Luna sia nel piano eclittico (inclinazione ), ma la forma della Luna è cilindrica, con il diametro del cilindro pari alla sua altezza. L’asse del cilindro è perpendicolare al piano eclittico. Per l’osservatore sulla Terra, disegna le fasi della Luna.
Topic: Astrophysics, Gravitation Metodi: Physical Modeling Competenze: Diagrammatic Reasoning Objects: Satellite, Planet, Star Fonte: Testo (PDF) — p.2 Soluzione: Soluzioni (PDF)
Below is a table of data indicating orbital radii and masses of solar system planets and some dwarf planets. Assume all orbits to be circular around the centre of mass of the solar system (C) and all objects to be in ecliptic plane.
| Object | Mass (kg) | Orbital Radius (km) | Object | Mass (kg) | Orbital Radius (km) |
|---|---|---|---|---|---|
| Mercury | Saturn | ||||
| Venus | Uranus | ||||
| Earth | Neptune | ||||
| Mars | Pluto | ||||
| Ceres | Eris | ||||
| Jupiter | – | – | – |
(a) [3] Either qualitatively describe or schematically draw what should be the configuration of these bodies around the Sun such that,
- (i) point C is as far as possible from the centre of the Sun (S).
- (ii) points C and S are as close to each other as possible.
(b) [7] Assuming all planets to be collinear, estimate the smallest possible distance between points C and S.
Topic: Gravitation, Astrophysics Metodi: Newton’s Law of Gravitation, Kepler’s Laws Competenze: Mathematical Modeling Objects: Planet, Star Fonte: Testo (PDF) — p.2 Soluzione: Soluzioni (PDF)
Di seguito è riportata una tabella di dati che indicano i raggi orbitali e le masse dei pianeti del sistema solare e di alcuni pianeti nani. Supponiamo che tutte le orbite siano circolari intorno al centro di massa del sistema solare (C) e che tutti gli oggetti siano in piano eclittico.
Oggetto # Mass (kg) # Radius Orbitare (km) # Oggetto # Mass (kg) # Radius Orbitare (km)
|---------|--------------------------|--------------------------|---------|--------------------------|--------------------------| | Mercury | | | Saturn | | | | Venus | | | Uranus | | | | Earth | | | Neptune | | | | Mars | | | Pluto | | | | Ceres | | | Eris | | | | Jupiter | | | – | – | – |
(a) [3] O descrivere qualitativamente o disegnare schematicamente quale dovrebbe essere la configurazione di questi corpi intorno al Sole in modo tale che:
- i) il punto C è il più lontano possibile dal centro del Sole (S).
- ii) i punti C e S sono il più vicini possibile.
b) [7] Supponendo che tutti i pianeti siano collineari, calcolare la distanza più piccola possibile tra i punti C e S.
Topic: Gravitation, Astrophysics Metodi: Newton’s Law of Gravitation, Kepler’s Laws Competenze: Mathematical Modeling Objects: Planet, Star Fonte: Testo (PDF) — p.2 Soluzione: Soluzioni (PDF)
Ameya has come up with an ambitious plan to set up a giant lens at an appropriate place between the Earth and the Sun to reduce the flux of light falling on all points on the Earth.
(a) [2] What type of lens should be used for this purpose?
(b) [2] Where should we put the lens so that this reduction in intensity is permanent?
(c) [3] What should be the minimum diameter of this lens?
(d) [6] Assuming that we want to reduce the temperature of the Earth by , what should be the focal length of this lens?
(e) [5] In reality, it is impractical to make a single lens of such a diameter. So Ameya’s plan B is to replace this single lens by an array (like a net with lens at every node) of lenses of diameter and focal length . How many such lenses are required to be placed at the same distance, in a circular area of same diameter as the bigger lens to produce the same temperature change?
(f) [2] If we want to replace the lenses in part (e) by opaque spheres of diameter , what would be the corresponding drop in temperature?
Topic: Geometric Optics, Astrophysics Metodi: Thin Lens & Mirror Equation, Order-of-Magnitude Estimation Competenze: Estimation & Approximation Objects: Lens, Planet, Star, Sphere Fonte: Testo (PDF) — p.2 Soluzione: Soluzioni (PDF)
Ameya ha ideato un ambizioso piano per installare una lente gigante in un posto appropriato tra la Terra e il Sole per ridurre il flusso di luce che cade su tutti i punti della Terra.
a) [2] Che tipo di obiettivo deve essere utilizzato a questo scopo?
b) [2] Dove si deve mettere la lente in modo che questa riduzione di intensità sia permanente?
c) [3] Qual è il diametro minimo di questa lente?
(d) [6] Supponendo che vogliamo ridurre la temperatura della Terra di , quale dovrebbe essere la distanza focale di questa lente?
(e) [5] In realtà, è impracticabile realizzare una singola lente di tale diametro. Quindi il piano B di Ameya è sostituire questa singola lente con un array (come una rete con lenti a ogni nodo) di lenti di diametro e distanza focale . Quante queste lenti devono essere posizionate alla stessa distanza, in un’area circolare dello stesso diametro della lente più grande per produrre lo stesso cambiamento di temperatura?
(f) [2] Se vogliamo sostituire le lenti nella parte (e) con sfere opache di diametro , quale sarebbe il declino di temperatura corrispondente?
Topic: Geometric Optics, Astrophysics Metodi: Thin Lens & Mirror Equation, Order-of-Magnitude Estimation Competenze: Estimation & Approximation Objects: Lens, Planet, Star, Sphere Fonte: Testo (PDF) — p.2 Soluzione: Soluzioni (PDF)
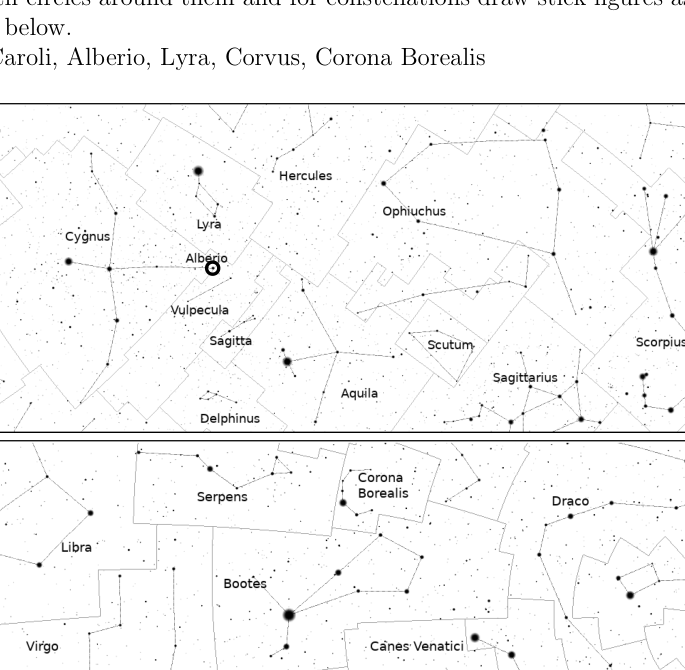
[14] Vinita prepared the two maps given below and gave those to students for practice on a certain date. At that time, the sky looked like the skymap in your answersheet. Use the practice maps to identify following constellations / stars in the skymap provided in your answersheet.
Mark stars with circles around them and for constellations draw stick figures as shown in the practice maps below.
Sagitta, Cor Caroli, Alberio, Lyra, Corvus, Corona Borealis
Quesito 4
Topic: Astrophysics Metodi: Physical Modeling Competenze: Diagrammatic Reasoning Objects: Star Fonte: Testo (PDF) — p.3 Soluzione: Soluzioni (PDF)
Vinita ha preparato le due mappe riportate di seguito e le ha date agli studenti per la pratica in una data determinata. A quel tempo, il cielo sembrava la mappa di cielo nella tua scheda di risposta. Utilizzare le mappe di pratica per identificare le seguenti costellazioni/stele nella mappa di cielo fornita nella scheda delle risposte.
Marcare le stelle con cerchi intorno a loro e per le costellazioni disegnare figure di bastone come mostrato nelle mappe pratiche di seguito.
Sagitta, Cor Caroli, Alberio, Lyra, Corvus, Corona Borealis
Quesito 4
Topic: Astrophysics Metodi: Physical Modeling Competenze: Diagrammatic Reasoning Objects: Star Fonte: Testo (PDF) — p.3 Soluzione: Soluzioni (PDF)
The maps of the Earth which you typically find in textbooks are printed with following criteria:
- All the latitudes and longitudes are straight lines.
- If any two points on the Earth along any longitude or along the equator have equal angular separation then on the map they will have equal linear distance.
Prathyush has a globe of Earth of radius . He also has a map of Earth with a projection described above. He noticed that the length of equator in this map as well as on the globe was exactly the same.
(a) [3] Find the ratio of the total surface area of the map to the area of the globe .
(b) [5] Two small squares E and F of identical size are drawn on this map (see the figure below). Square E lies very near to the equator, while square F lies at a latitude of . Find the ratios , and where,
- corresponds to area of E as measured on the globe
- corresponds to area of E as measured on the map.
- corresponds to area of F as measured on the globe
- corresponds to area of F as measured on the map.
Quesito 5
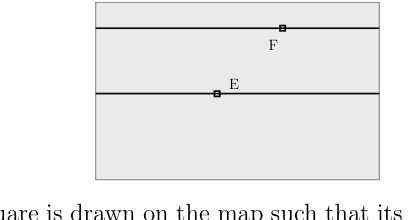
(c) [2] A large square is drawn on the map such that its sides are units (). Lower side of this square is located on the equator. Draw approximate shape of the projection of this square as it appears on the globe.
Topic: Astrophysics, Geometric Optics Metodi: Physical Modeling Competenze: Mathematical Modeling Objects: Planet Fonte: Testo (PDF) — p.4 Soluzione: Soluzioni (PDF)
Le mappe della Terra che si trovano in genere nei libri di testo sono stampate con i seguenti criteri:
- Tutte le latitudini e le longitudini sono linee rette.
- Se due punti sulla Terra lungo qualsiasi longitudine o lungo l’equatore hanno la stessa separazione angolare, sulla mappa avranno la stessa distanza lineare.
Prathyush ha un globo terrestre di raggio . Ha anche una mappa della Terra con una proiezione descritta sopra. Ha notato che la lunghezza dell’equatore in questa mappa e sul globo era esattamente la stessa.
(a) [3] Trova il rapporto tra la superficie totale della mappa e la superficie del globo .
b) [5] Su questa mappa sono disegnati due piccoli quadrati E e F di dimensioni identiche (vedi figura seguente). Il quadrato E si trova molto vicino all’equatore, mentre il quadrato F si trova a una latitudine di . Trova i rapporti , e , dove:
- corrisponde all’area di E misurata sul globo
- corrisponde all’area di E misurata sulla mappa.
- corrisponde all’area di F misurata sul globo
- corrisponde all’area di F misurata sulla mappa.
Quesito 5
c) [2] Su una mappa viene disegnato un grande quadrato in modo che i suoi lati siano unità (). Il lato inferiore di questo quadrato si trova sull’equatore. Disegnare una forma approssimativa della proiezione di questo quadrato come appare sul globo.
Topic: Astrophysics, Geometric Optics Metodi: Physical Modeling Competenze: Mathematical Modeling Objects: Planet Fonte: Testo (PDF) — p.4 Soluzione: Soluzioni (PDF)
[10] Consider a cylindrical metallic wire of cross-sectional area , length , and resistance at ambient temperature , which is also the temperature of the wire at the start of experiment. The resistance of the wire varies as a function of temperature . Assume it acts like a perfect blackbody with an indefinitely high melting point. The wire undergoes cooling only via radiation and its dimensions are unaffected by any change in temperature. Sketch the approximate temperature vs. time graph if the ends of the wire are maintained at a constant potential difference ().
Topic: Circuits, Thermodynamics Metodi: Differential Equations Competenze: Mathematical Modeling Objects: Wire, Battery Fonte: Testo (PDF) — p.4 Soluzione: Soluzioni (PDF)
[10] Considerare un filo metallico cilindrico di area di sezione trasversale , lunghezza e resistenza a temperatura ambiente , che è anche la temperatura del filo all’inizio dell’esperimento. La resistenza del filo varia in funzione della temperatura . Supponiamo che si comporti come un corpo nero perfetto con un punto di fusione indefinitamente alto. Il filo è raffreddato solo con radiazioni e le sue dimensioni non sono influenzate da alcun cambiamento di temperatura. Segna la temperatura approssimativa vs. grafico temporale se le estremità del filo sono mantenute a una differenza di potenziale costante ().
Topic: Circuits, Thermodynamics Metodi: Differential Equations Competenze: Mathematical Modeling Objects: Wire, Battery Fonte: Testo (PDF) — p.4 Soluzione: Soluzioni (PDF)
Separated from his friends, Yash landed up on an island on 23rd September. On the same day, with nothing better to do, he meticulously measured height of tide at every hour. This data is tabulated in Table 1 below.
To model the tide height as a function of time, he made following simplifying assumptions;
- Tides are caused ONLY by the gravitational pull of the Moon (i.e. ignore gravitational pull due to Sun).
- Ignore the effect of Earth’s rotation on the tides.
- Ignore friction between the surface of the Earth and the water.
Table 1: Data for height of tide at every hour (local time) on a 23rd September.
| Time (hrs) | Height (m) | Time (hrs) | Height (m) | Time (hrs) | Height (m) |
|---|---|---|---|---|---|
| 00:00 | 0.538 | 08:00 | 0.45 | 16:00 | 0.756 |
| 01:00 | 0.616 | 09:00 | 0.341 | 17:00 | 0.812 |
| 02:00 | 0.708 | 10:00 | 0.307 | 18:00 | 0.786 |
| 03:00 | 0.753 | 11:00 | 0.33 | 19:00 | 0.733 |
| 04:00 | 0.786 | 12:00 | 0.372 | 20:00 | 0.666 |
| 05:00 | 0.741 | 13:00 | 0.482 | 21:00 | 0.622 |
| 06:00 | 0.639 | 14:00 | 0.572 | 22:00 | 0.583 |
| 07:00 | 0.554 | 15:00 | 0.676 | 23:00 | 0.545 |
(a) [10] Plot the given data.
(b) [4] Using the plot, find the Sun-Earth-Moon angle.
(c) [2] Find the date of the nearest New Moon.
(d) [6] Later he explored interiors of the island, including a large cave system, and had erratic eating and sleeping schedule. As a result, when he returned to the beach, he had lost track of time. He again started measuring tide height to get a sense of date. However, this time, he was also busy in other activities such as food gathering and raft making. So his readings, as given in Table 2, are taken only sporadically. Find the height of the tide at 16:00 hours on that day, by overplotting this data on the same graph paper.
(e) [2] Which is the date corresponding to Table 2?
Table 2: Height versus time data
| Time (hrs) | Height (m) | Time (hrs) | Height (m) |
|---|---|---|---|
| 00:00 | 1.014 | 12:00 | 0.748 |
| 01:00 | 1.079 | 13:00 | 0.855 |
| 02:00 | 1.033 | 14:00 | 0.844 |
| 03:00 | 0.905 | 18:00 | 0.279 |
| 07:00 | 0.255 | 19:00 | 0.213 |
| 08:00 | 0.235 | 20:00 | 0.203 |
| 09:00 | 0.322 | 21:00 | 0.307 |
| 10:00 | 0.445 | 23:00 | 0.682 |
Topic: Gravitation, Astrophysics Metodi: Newton’s Law of Gravitation, Curve Fitting Competenze: Curve Fitting Objects: Satellite, Planet, Star Fonte: Testo (PDF) — p.4 Soluzione: Soluzioni (PDF)
Separato dai suoi amici, Yash è sbarcato su un’isola il 23 settembre. Nello stesso giorno, senza fare niente di meglio, misurò meticolosamente l’altezza della marea ogni ora. Questi dati sono riportati nella tabella 1 di seguito.
Per modellare l’altezza della marea come funzione del tempo, ha fatto seguendo ipotesi semplificanti;
- Le maree sono causate SOLO dalla forza gravitazionale della Luna (cioè ignorare la forza gravitazionale dovuta al Sole).
- Ignora l’effetto della rotazione terrestre sulle maree.
- Ignora gli attriti tra la superficie terrestre e l’acqua.
Tabella 1: dati per l’altezza della marea ad ogni ora (ora locale) il 23 settembre.
Il tempo # l’ora # L’altezza # l’ora # l’altezza # l’ora # l’ora # l’altezza # l’ora # l’altezza # l’ora # l’ora # l’ora # l’ora # l’ora # l’ora # l’ora # l’ora # l’ora # l’ora # l’ora # l’ora # l’ora # l’ora # l’ora # l’ora # l’ora # l’ora # l’ora # l’ora # l’ora # l’ora # l’ora # l’ora # l’ora # l’ora # l’ora # l’ora # l’ora # l’ora # l’ora # l’ora # l’ora # l’ora # l’ora # l’ora # l’ora # l’ora # l’ora # l’ora # l’ora # l’ora # l’ora # l’ora # l’ora # l’ora # l’ora # l’ora # l’ora # l’ora # l’ora # l’ora # l’ora # l’ora # l’ora # l’ora # l’ora # l’ora # l’ora # l’ora # l’ora # l’ora # l’ora # l’ora # l’ora # # # # # l’ora # # # # # # # # # # l’ora # # # # # # # # # # # # # # # # # # # # # # # # # # # # # # # # # # # # # # # # # # # # # # # # # # # # # # # # # # # # # # # # # # # # # # # # # # # # # # # # # # # # # # # # # # # # # # # # # # # # # # # # # # # # # # # # # # # # # # # # # # # # # # # # # # # # # # # # # # # # # # # # # # # # # # # # # # # # # # # # # # # # # # # # # # # # # # # # # # # # # # # # # #
|------------|------------|------------|------------|------------|------------| | 00:00 | 0.538 | 08:00 | 0.45 | 16:00 | 0.756 | | 01:00 | 0.616 | 09:00 | 0.341 | 17:00 | 0.812 | | 02:00 | 0.708 | 10:00 | 0.307 | 18:00 | 0.786 | | 03:00 | 0.753 | 11:00 | 0.33 | 19:00 | 0.733 | | 04:00 | 0.786 | 12:00 | 0.372 | 20:00 | 0.666 | | 05:00 | 0.741 | 13:00 | 0.482 | 21:00 | 0.622 | | 06:00 | 0.639 | 14:00 | 0.572 | 22:00 | 0.583 | | 07:00 | 0.554 | 15:00 | 0.676 | 23:00 | 0.545 |
(a) [10] Tracciare i dati forniti.
(b) [4] Usando la trama, trovare l’angolo Sole-Terra-Luna.
c) [2] Trova la data della Luna Nuova più vicina.
(d) [6] Successivamente esplorò gli interni dell’isola, compresi un grande sistema di grotte, e aveva un programma di alimentazione e di sonno irregolare. Di conseguenza, quando tornò sulla spiaggia, aveva perso la visione del tempo. Ha iniziato di nuovo a misurare l’altezza della marea per avere un senso della data. Tuttavia, questa volta era anche impegnato in altre attività come raccogliere cibo e fare balene. Le letture, come riportate nella tabella 2, sono quindi prese solo sporadicamente. Trova l’altezza della marea alle 16:00 di quel giorno, superando questi dati sulla stessa carta grafica.
e) [2] Qual è la data corrispondente alla tabella 2?
**Tabella 2: Altezze e tempi **
♬ Tempo (orari) ♬ Altezza (m) ♬ Tempo (orari) ♬ Altezza (m) ♬ |------------|------------|------------|------------| | 00:00 | 1.014 | 12:00 | 0.748 | | 01:00 | 1.079 | 13:00 | 0.855 | | 02:00 | 1.033 | 14:00 | 0.844 | | 03:00 | 0.905 | 18:00 | 0.279 | | 07:00 | 0.255 | 19:00 | 0.213 | | 08:00 | 0.235 | 20:00 | 0.203 | | 09:00 | 0.322 | 21:00 | 0.307 | | 10:00 | 0.445 | 23:00 | 0.682 |
Topic: Gravitation, Astrophysics Metodi: Newton’s Law of Gravitation, Curve Fitting Competenze: Curve Fitting Objects: Satellite, Planet, Star Fonte: Testo (PDF) — p.4 Soluzione: Soluzioni (PDF)