1. [6 marks] Dancing on the floor
There are various apps that record the intensity of an audio signal. An app (WaveEditor™ here) displays the audio signal as a wave, whose amplitude is proportional to the audio signal’s loudness. A smartphone with this app recording the sound signal is kept on a uniformly built flat floor of a classroom.
A perfectly small spherical steel ball is thrown up such that it almost touches the ceiling and comes back without hitting. The ball hits the floor and thereafter it keeps bouncing. The app records the sound signal produced when the ball hits the floor on every bounce. A screenshot of the recording is shown. The timestamps (in seconds) of the first eight consecutive bounces are also shown next to the peak. For example, the app records a peak at s when the first time the ball hits the floor.
The timestamps (in seconds) of the bounces shown next to the peaks are: , , , , , , , .
Quesito 1
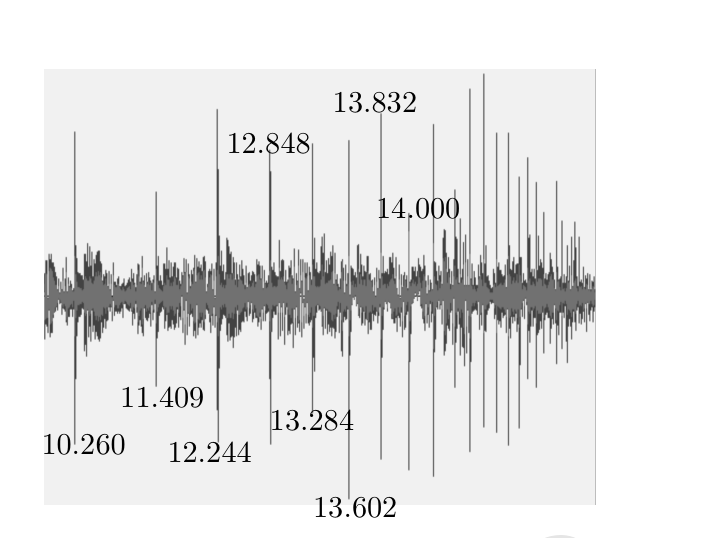
Make reasonable assumptions, when the ball hits the floor and calculate the height of the classroom from the given data. State your assumptions clearly.
Topic: Newtonian Mechanics Metodi: Kinematic Equations, Conservation of Energy Competenze: Experimental Data Analysis Objects: Ball Fonte: Testo (PDF) — p.2 Soluzione: Soluzioni (PDF)
1. [6 punti] Danza sul pavimento
Ci sono varie app che registrano l’intensità di un segnale audio. Un’app (WaveEditorTM qui) visualizza il segnale audio come un’onda, la cui amplitudine è proporzionale alla altezza del segnale audio. Uno smartphone con questa app che registra il segnale sonoro è tenuto su un piano piano uniforme di una classe.
Una palla di acciaio sferica perfettamente piccola viene lanciata in modo tale che tocchi quasi il soffitto e ritorna senza colpire. La palla colpisce il pavimento e poi continua a saltare. L’app registra il segnale sonoro prodotto quando la palla colpisce il pavimento ad ogni rimbalzo. Viene mostrato uno screenshot della registrazione. I timestamp (in secondi) dei primi otto salti consecutivi sono mostrati anche accanto al picco. Ad esempio, l’app registra un picco a s quando la palla colpisce il pavimento per la prima volta.
I timestamp (in secondi) dei rimbalzi mostrati accanto alle cime sono: , , , , , , , .
Quesito 1
Fate ipotesi ragionevoli, quando la palla colpisce il pavimento e calcolate l’altezza della classe a partire dai dati forniti. Esprimi le tue ipotesi chiaramente.
Topic: Newtonian Mechanics Metodi: Kinematic Equations, Conservation of Energy Competenze: Experimental Data Analysis Objects: Ball Fonte: Testo (PDF) — p.2 Soluzione: Soluzioni (PDF)
2. [6 marks] Knock it off!
Consider a W small isotropic source of blue light of wavelength . A metallic surface of and work function eV is kept at a distance of m from the source and oriented to receive normal radiation.
(a) [2 marks] Assume that all the energy is uniformly absorbed by atoms on the top layer of the surface. Also, all the energy absorbed by an atom on the surface is taken up by one electron. The radius of the atom is . Estimate the time needed by the electron to receive eV of energy.
(b) [1 marks] According to the above classical model, how many electrons are emitted by the metallic surface in time ?
(c) [2 marks] In quantum theory, photons are emitted and absorbed as quanta. Assuming photoelectric efficiency of , calculate the rate of emission of electrons () from the surface.
(d) [1 marks] Assuming further that all the emitted photoelectrons move normal to the surface what would be the maximum current density () one may expect?
Topic: Modern-Quantum Physics Metodi: Photon Energy Relation, Order-of-Magnitude Estimation Competenze: Estimation & Approximation Objects: Photon, Electron Fonte: Testo (PDF) — p.2 Soluzione: Soluzioni (PDF)
**2. Basta!
Si consideri una fonte isotròpica W di luce blu di lunghezza d’onda . Una superficie metallica di e funzione di lavoro eV è tenuta a una distanza di m dalla sorgente e orientata a ricevere radiazioni normali.
(a) [2 punti] Supponiamo che tutta l’energia sia assorbita uniformemente dagli atomi sul livello superiore della superficie. Inoltre, tutta l’energia assorbita da un atomo sulla superficie viene assorbita da un elettrone. Il raggio di radio dell’atomo è . Calcolare il tempo necessario all’elettrone per ricevere eV di energia.
b) [1 marchio] Secondo il modello classico di cui sopra, quanti elettroni vengono emessi dalla superficie metallica nel tempo ?
(c) [2 punti] Nella teoria quantistica, i fotoni vengono emessi e assorbiti come quanti. Supponendo un’efficienza fotoelettrica di , calcolare il tasso di emissione di elettroni () dalla superficie.
D) [1 marchio] Supponendo inoltre che tutti i fotovoltai emessi si muovano normalmente verso la superficie quale sarebbe la densità massima di corrente () da cui si potrebbe aspettarsi?
Topic: Modern-Quantum Physics Metodi: Photon Energy Relation, Order-of-Magnitude Estimation Competenze: Estimation & Approximation Objects: Photon, Electron Fonte: Testo (PDF) — p.2 Soluzione: Soluzioni (PDF)
3. [16 marks] Work in progress
One mole of an ideal monoatomic gas goes through a linear process from A to B as shown in the pressure-volume (-) diagram. The temperature at A is . The process is such that, the temperature decreases and the heat is continuously supplied to the gas. The ratio of the specific heat at the constant pressure to that at the constant volume is . Obtain the expression for the maximum work () the gas can perform in such a process. Calculate .
\begin{document}
\begin{tikzpicture}[>=stealth]
  \draw[->] (0,0) -- (5,0) node[right] {$V$};
  \draw[->] (0,0) -- (0,4) node[above] {$P$};
  \draw[thick] (0.8,3.4) -- (4.2,0.6);
  \fill (0.8,3.4) circle (2pt) node[above right] {$A$};
  \fill (4.2,0.6) circle (2pt) node[above right] {$B$};
\end{tikzpicture}
\end{document}
Topic: Thermodynamics Metodi: First Law of Thermodynamics, Ideal Gas Law Competenze: Mathematical Modeling Objects: Gas Fonte: Testo (PDF) — p.2 Soluzione: Soluzioni (PDF)
3. [16 punti] Progressi di lavoro
Un mole di un gas monoatomo ideale passa attraverso un processo lineare da A a B come mostrato nel diagramma di pressione-volume (-). La temperatura a A è . Il processo è tale che la temperatura diminuisce e il calore viene continuamente fornito al gas. Il rapporto tra il calore specifico alla pressione costante e quello al volume costante è . Ottenere l’espressione per il lavoro massimo () che il gas può eseguire in tale processo. Calcolare .
\begin{document}
\begin{tikzpicture}[>=stealth]
  \draw[->] (0,0) -- (5,0) node[right] {$V$};
  \draw[->] (0,0) -- (0,4) node[above] {$P$};
  \draw[thick] (0.8,3.4) -- (4.2,0.6);
  \fill (0.8,3.4) circle (2pt) node[above right] {$A$};
  \fill (4.2,0.6) circle (2pt) node[above right] {$B$};
\end{tikzpicture}
\end{document}
Topic: Thermodynamics Metodi: First Law of Thermodynamics, Ideal Gas Law Competenze: Mathematical Modeling Objects: Gas Fonte: Testo (PDF) — p.2 Soluzione: Soluzioni (PDF)
4. [16 marks] Electrostatic TikTok
Consider a fixed infinite vertical thin rod (shown by the red color in the figure below) of linear charge density along the -axis at the origin (see figure below). A uniformly charged ring of total charge , mass , and radius is placed with its center at the origin in the - plane. Point P is an arbitrary point on the ring. The projection of point P on - plane makes an angle with respect to the -axis in the anticlockwise direction as seen from the top.
The ring is now given an initial angular velocity about the -axis. We define the angle which the plane of the ring makes with the - plane. This is illustrated by drawing line segment AB in the plane of the ring. Initially . Ignore gravity.
\begin{document}
\begin{tikzpicture}[>=stealth]
  % axes
  \draw[->] (0,0) -- (3.2,-1.2) node[right] {$x$};
  \draw[->] (0,0) -- (4,0.6) node[right] {$y$};
  \draw[->] (0,-2) -- (0,2.4) node[above] {$z$};
  % infinite rod (red) along z
  \draw[red,very thick] (0,-2) -- (0,2.2);
  % ring in x-y plane (ellipse for perspective)
  \draw[thick] (0,0) ellipse (2.6 and 0.9);
  % point P on ring
  \fill (1.9,0.6) circle (1.5pt) node[above] {$P$};
  % line AB across ring
  \draw[dashed] (-2.4,-0.3) node[left] {$A$} -- (2.4,0.3) node[right] {$B$};
  % angle theta marker
  \draw (0.8,0) arc (0:25:0.8);
  \node at (1.0,0.18) {$\theta$};
\end{tikzpicture}
\end{document}
You may find the following differentiation useful
(a) [1 marks] State an expression for the electric field () due to the infinite rod at a point on the ring when in terms of , and , and related quantities.
(b) [2 marks] At some instant the ring makes an angle . Derive an expression for the electric field due to the infinite rod at a point on the ring in terms of , and .
(c) [1 marks] Find the net force acting on the ring.
(d) [5 marks] Find the net torque acting on the ring in terms of and the constants only. Qualitatively plot torque as a function of .
(e) [2 marks] Let the ring is in equilibrium with respect to . Derive an expression for the time period of small oscillations of the ring in terms of , and . Take , , , radius , and . Calculate .
(f) [2.5 marks] Find an expression for the potential energy of the ring in terms of . Qualitatively plot as a function of . Take the zero of potential energy to be at .
(g) [2.5 marks] Obtain the expression of maximum value of () in terms of . Calculate .
Topic: Electrostatics Metodi: Gauss’s Law, Torque & Angular Momentum Analysis Competenze: Mathematical Modeling Objects: Rod Fonte: Testo (PDF) — p.3 Soluzione: Soluzioni (PDF)
4. [16 punti] TikTok elettrostatico
Considera una barra sottile verticale fissa infinita (mostrata dal colore rosso nella figura di seguito) di densità di carica lineare lungo l’asse all’origine (vedere figura di seguito). Un anello con carica uniforme di carica totale , massa e raggio è posizionato con il suo centro all’origine nel piano -. Il punto P è un punto arbitrario sull’anello. La proiezione del punto P sul piano - fa un angolo rispetto all’asse nella direzione anticlockwise vista dall’alto.
L’anello viene ora dato una velocità angolare iniziale circa l’asse . Definitiamo l’angolo che il piano dell’anello fa con il piano -. Questo è illustrato disegnando il segmento AB della linea nel piano dell’anello. Inizialmente . Ignora la gravità.
\begin{document}
\begin{tikzpicture}[>=stealth]
  % axes
  \draw[->] (0,0) -- (3.2,-1.2) node[right] {$x$};
  \draw[->] (0,0) -- (4,0.6) node[right] {$y$};
  \draw[->] (0,-2) -- (0,2.4) node[above] {$z$};
  % infinite rod (red) along z
  \draw[red,very thick] (0,-2) -- (0,2.2);
  % ring in x-y plane (ellipse for perspective)
  \draw[thick] (0,0) ellipse (2.6 and 0.9);
  % point P on ring
  \fill (1.9,0.6) circle (1.5pt) node[above] {$P$};
  % line AB across ring
  \draw[dashed] (-2.4,-0.3) node[left] {$A$} -- (2.4,0.3) node[right] {$B$};
  % angle theta marker
  \draw (0.8,0) arc (0:25:0.8);
  \node at (1.0,0.18) {$\theta$};
\end{tikzpicture}
\end{document}
Potreste trovare utile la seguente differenziazione
a) [1 marchio] Indicare un’espressione per il campo elettrico () dovuto alla canna infinita in un punto dell’anello quando in termini di , e , e quantità correlate.
b) [2 punti] In un istante l’anello fa un angolo . Derivare un’espressione per il campo elettrico dovuto alla canna infinita in un punto dell’anello in termini di e .
c) [1 marchio] Trova la forza netta che agisce sull’anello.
d) [5 punti] Trova la coppia netta che agisce sull’anello in termini di e solo delle costanti. Torque di tracciato qualitativo in funzione di .
(e) [2 punti] Che l’anello sia in equilibrio rispetto a . Derivare un’espressione per il periodo di tempo di piccole oscillazioni dell’anello in termini di e . Prendi , , , raggio e . Calcolare .
(f) [2,5 punti] Trovare un’espressione per l’energia potenziale dell’anello in termini di . Grafica qualitativa come funzione di . Prendiamo lo zero di energia potenziale per essere .
(g) [2,5 marchi] Ottenere l’espressione del valore massimo di () in termini di . Calcolare .
Topic: Electrostatics Metodi: Gauss’s Law, Torque & Angular Momentum Analysis Competenze: Mathematical Modeling Objects: Rod Fonte: Testo (PDF) — p.3 Soluzione: Soluzioni (PDF)
5. [16 marks] If Prof. Snell had a smartphone
A typical smartphone screen is made up of mainly two components: a sheet of touch-sensitive glass (where you move your finger to operate the phone) of thickness at the top and a LCD screen below it consisting of a regular array of “RGB elements” that emit light. These elements have a separation of between them. There is a thin air gap of depth between the touch-sensitive glass and the LCD screen (see Fig. (1) for a cross sectional view). We estimate the value of from the following experiment.
Quesito 5
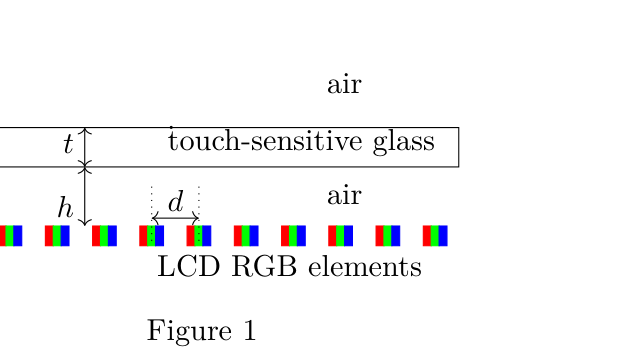
We use two smartphones (S-I and S-II) in this exercise – S-I is the target instrument in which we want to estimate , and S-II is the measuring instrument that can capture photos of the screen of S-I which we then analyse using a image-processing software.
A digital image captured by the camera of a smartphone (S-II here) consists of discrete picture elements called pixels. The image captured by S-II is processed through a software. A red color reference line is drawn on the image (see Fig. 3(a)). The software plots the “brightness value” at every point of the reference line as a function of the number of pixels from the left end of the line. Thus, pixel number is a marker for distance here. First, we need to calibrate distance in terms of pixel number.
The phone S-I is kept horizontal and the display is kept ON. A ruler is placed on its screen. S-II is fixed above S-I to capture images. The image of the screen captured is shown in Fig (2).
Quesito 5
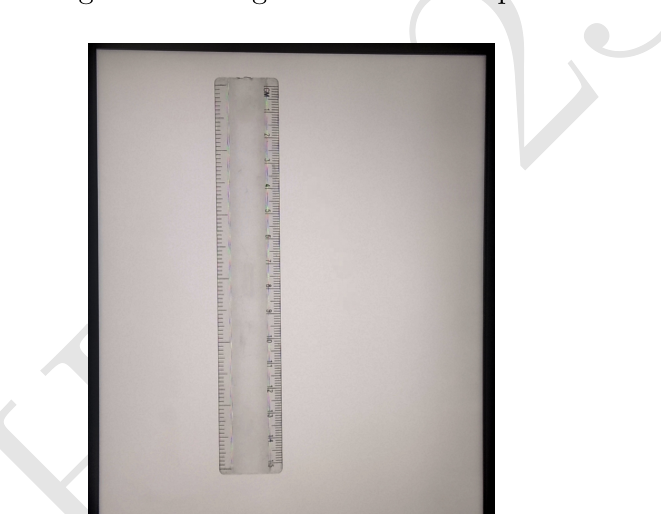
Figure 3(a) shows a part of the image of the ruler and its brightness value profile along the red reference line in Fig. 3(b).
Quesito 5
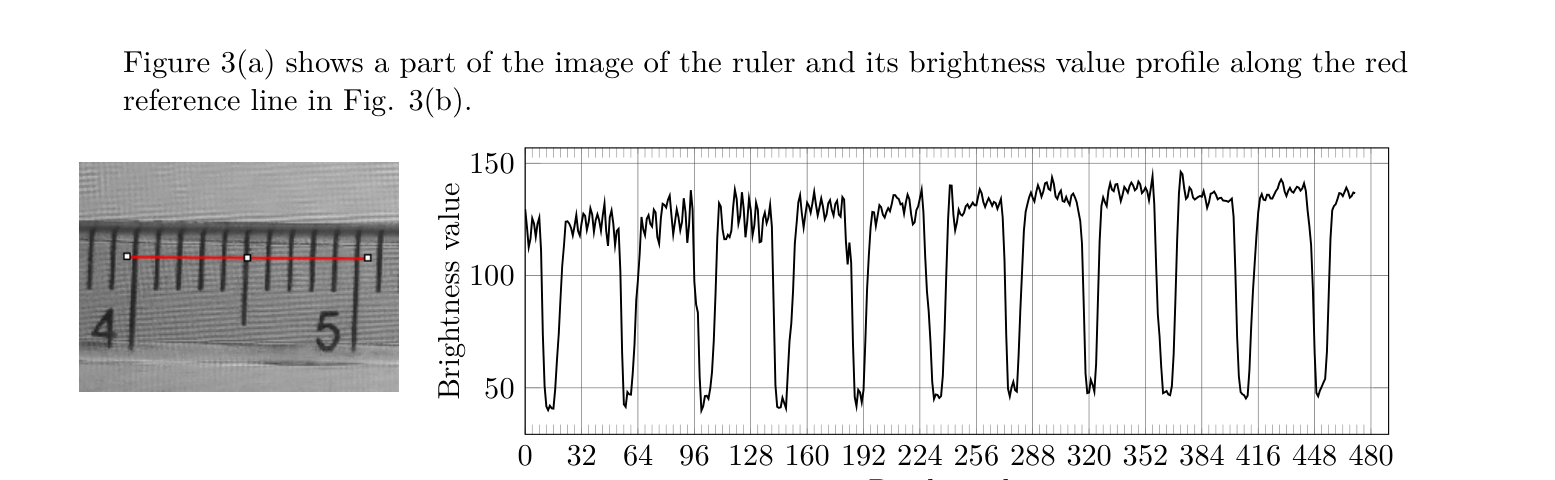
(a) [2 marks] State the number of pixels used by the camera of S-II to capture one centimeter of the screen of S-I.
(b) [5 marks] We keep the setup the same as the last part. Next, a few small water drops are placed on the glass screen of S-I beside the ruler (see Figs. 4(a) and 4(b) for a top and side view, respectively). We model every drop as a hemispherical lens of radius that magnifies the array of RGB elements of the LCD screen of S-I (see Fig. 4(c); the figure is not to scale).
Quesito 5
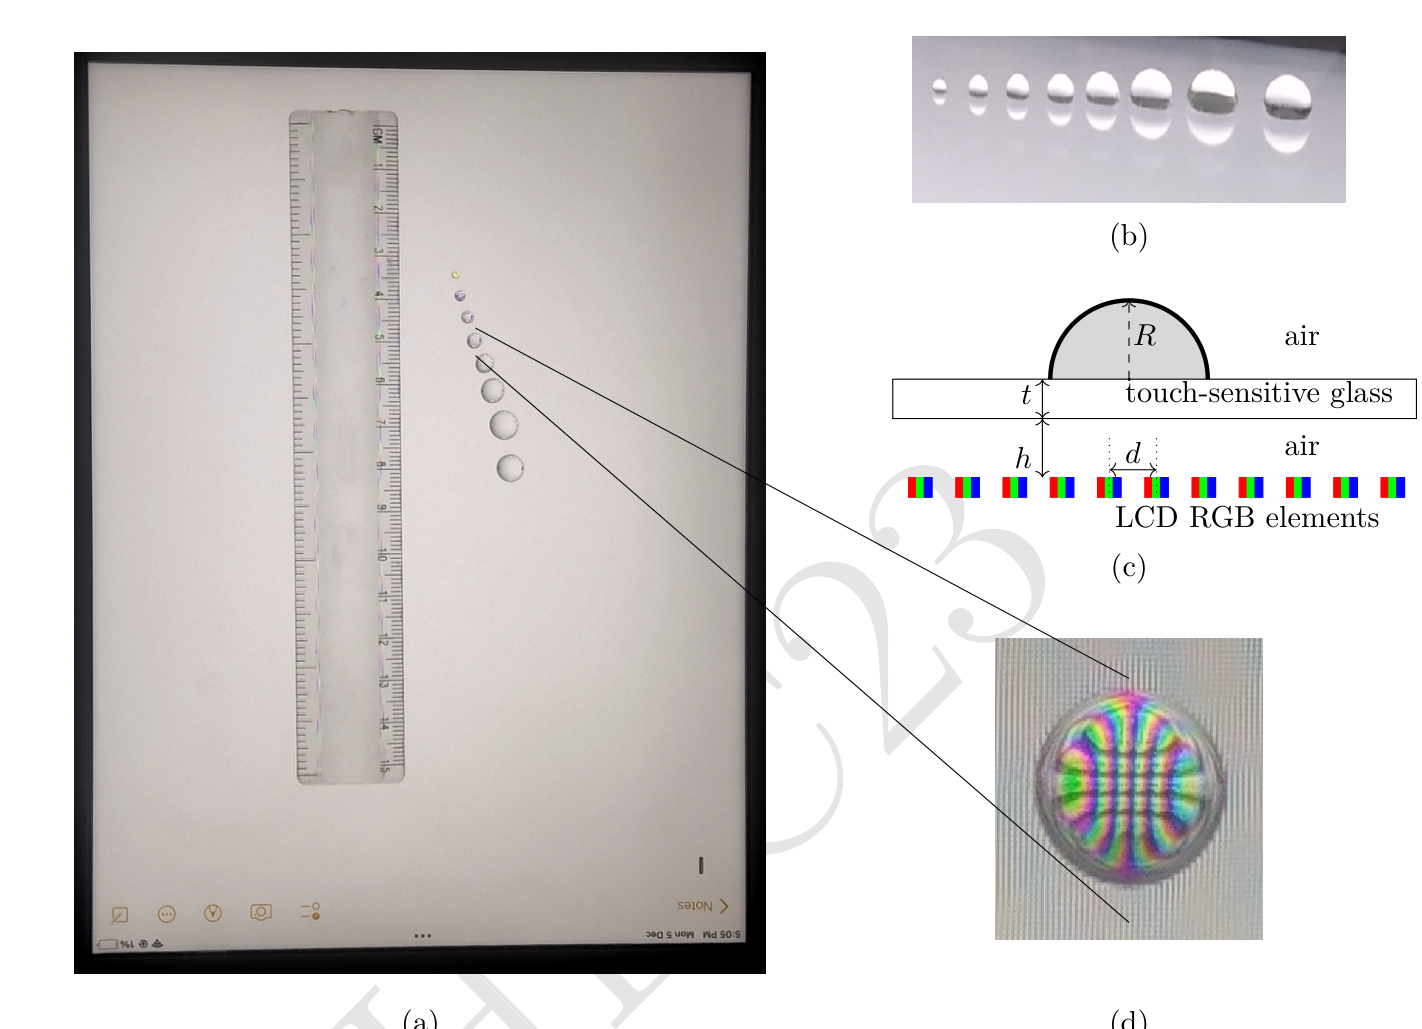
Figure 4(d) shows the magnified image of the array of the RGB elements of the screen as viewed from the top through one of the drops. This image is captured by S-II keeping the camera settings and distance same as in the previous part. The brightness value profiles of the images of the five chosen drops along the reference lines are shown in Fig. (5) on the next page.
Using the profile plots, write the radius of the water drop ( in mm) and the corresponding magnification () of the separation between the array of RGB elements of S-I for each waterdrop lens. Use the table in the Summary Answer sheet to report your data. Describe the method you have used and the calculations in the Detailed Answer sheet.
Quesito 5
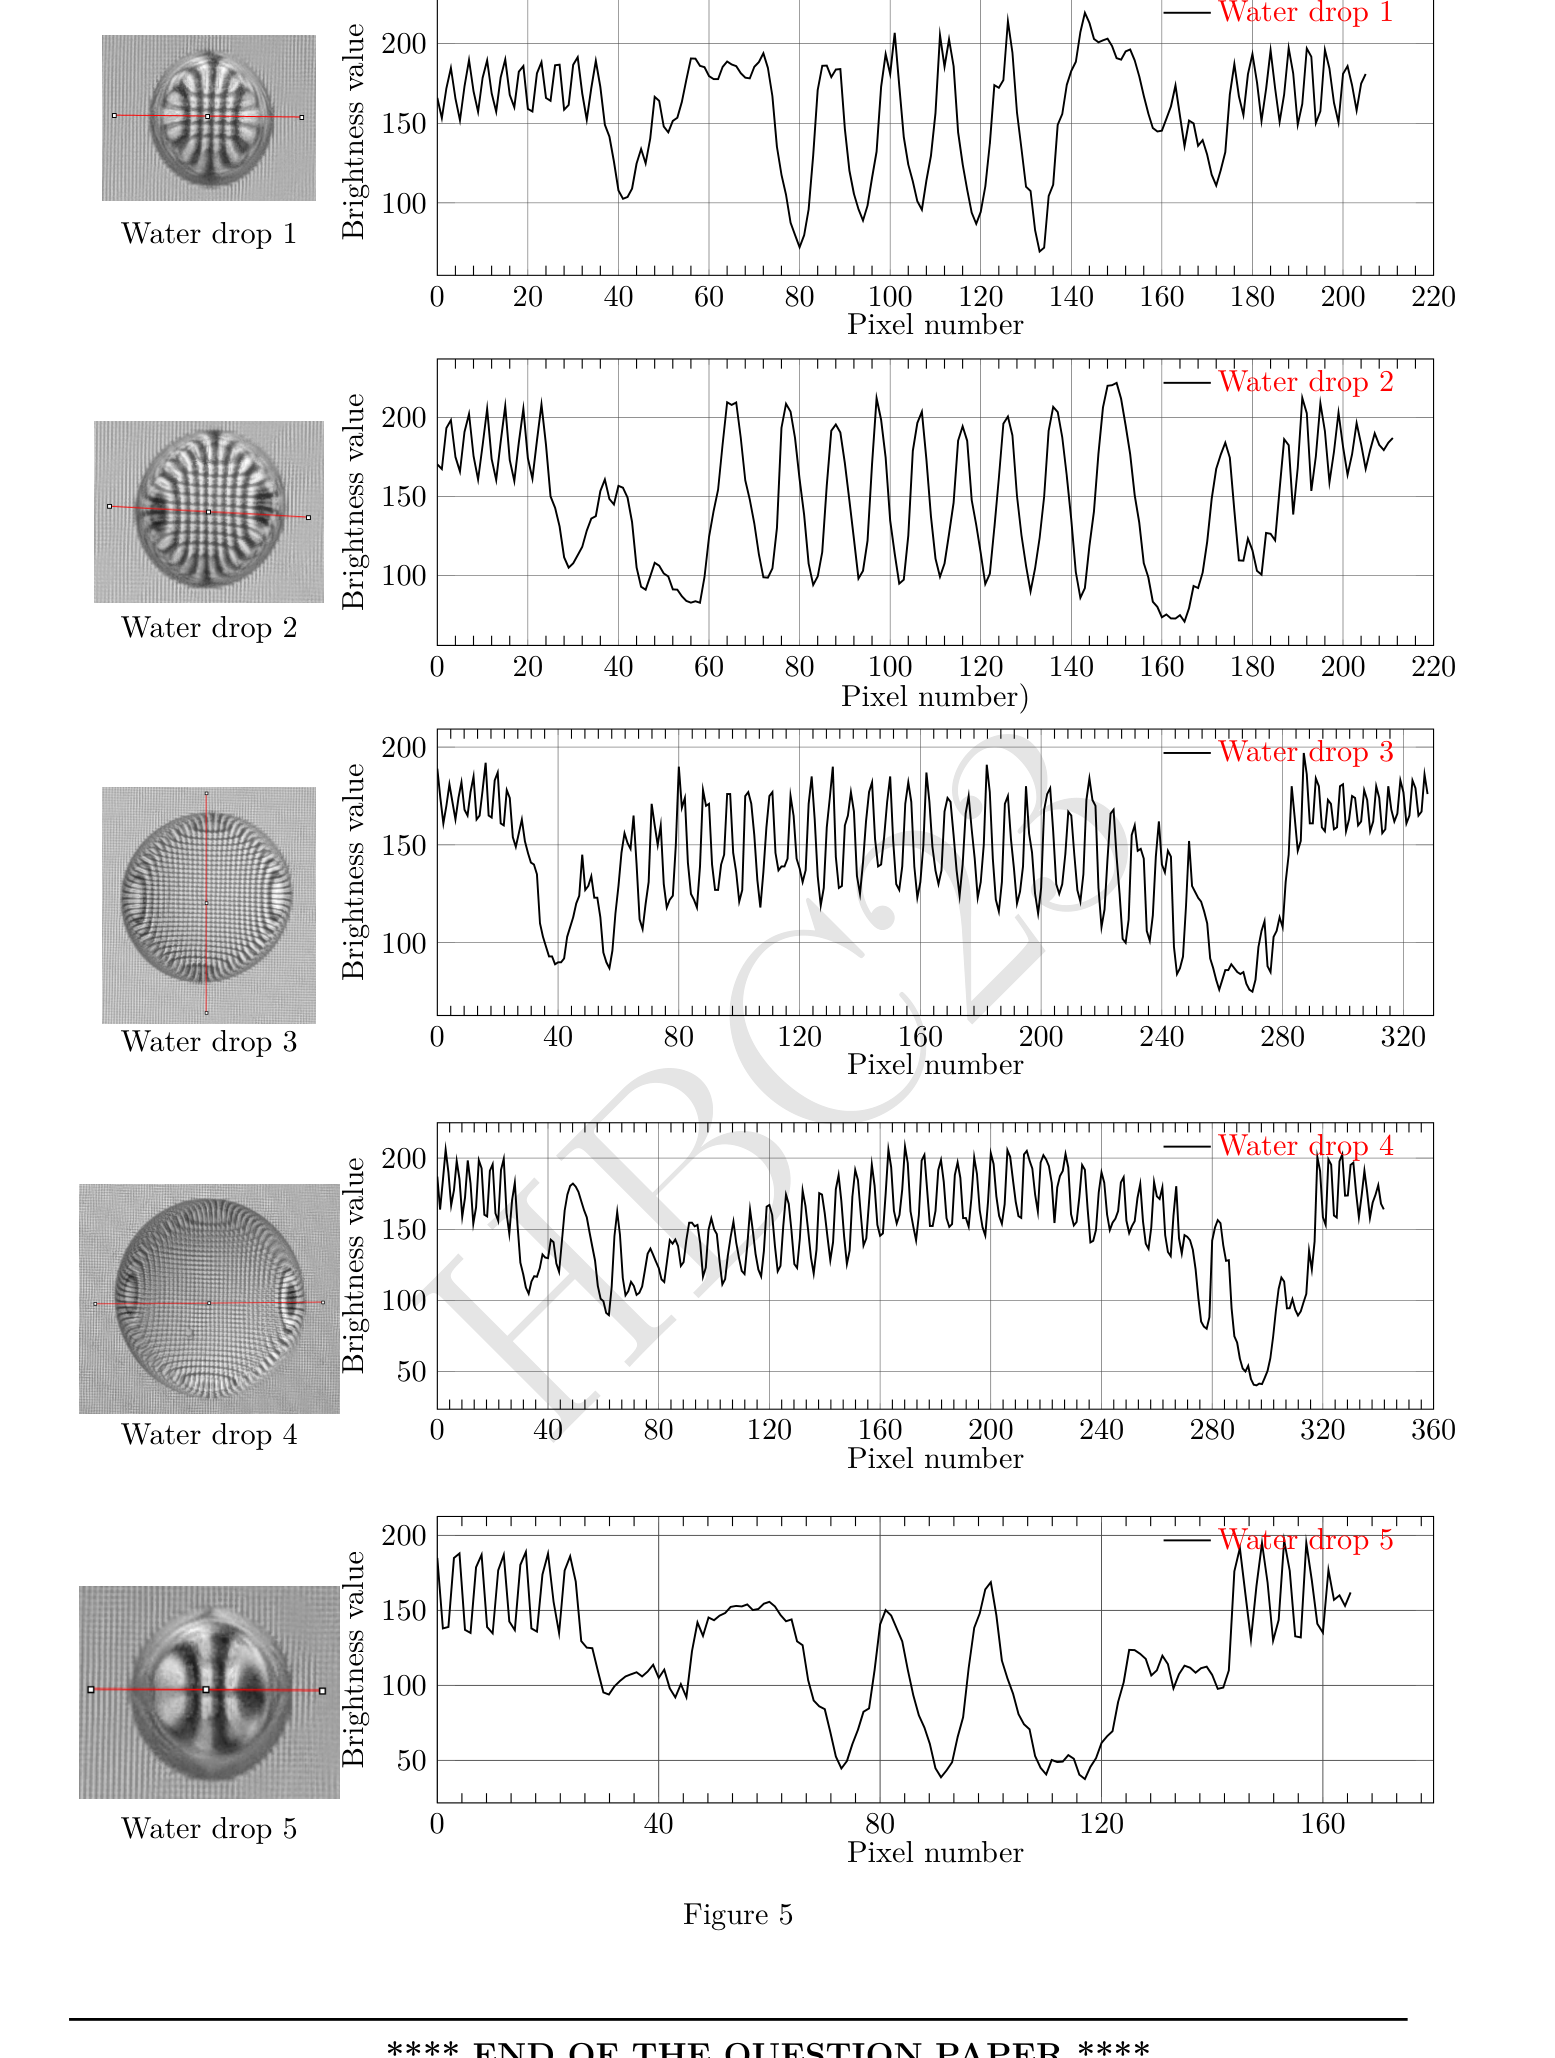
(c) [9 marks] For the given smartphone, , the refractive indices of the touch-sensitive glass, water drop, and the air to be , , and respectively. Using the data table of the previous part, plot a suitable linear graph to obtain the distance () of the RGB elements from the touch-sensitive glass. Use the table given in the summary answer sheet to enter the data used to plot the graph. Show your detailed theoretical calculation in the Detailed Answer sheet.
Topic: Geometric Optics Metodi: Snell’s Law, Experimental Data Analysis Competenze: Experimental Data Analysis Objects: Lens, Droplet Fonte: Testo (PDF) — p.4 Soluzione: Soluzioni (PDF)
**5. Se il Prof. Snell aveva uno smartphone.
Un tipico schermo di smartphone è composto principalmente da due componenti: un foglio di vetro sensibile al tatto (dove si muove il dito per gestire il telefono) di spessore in alto e un schermo LCD al di sotto che consiste in una serie regolare di “elementi RGB” che emettono luce. Questi elementi hanno una separazione di tra loro. C’è un gap di profondità tra il vetro sensibile al tatto e lo schermo LCD (vedi figura 1. (1) per una visione trasversale). Stimo stimando il valore di dal seguente esperimento.
Quesito 5
In questo esercizio usiamo due smartphone (S-I e S-II) S-I è lo strumento di destinazione in cui vogliamo stimare , e S-II è lo strumento di misurazione che può catturare le foto dello schermo di S-I che poi analizziamo utilizzando un software di elaborazione delle immagini.
Un’immagine digitale catturata dalla fotocamera di uno smartphone (S-II qui) è composta da elementi di immagine discreti chiamati pixel. L’immagine catturata da S-II viene elaborata tramite un software. L’immagine è disegnata con una linea di riferimento di colore rosso (vedi figura 1). 3(a)). Il software traccia il “valore di luminosità” in ogni punto della linea di riferimento come funzione del numero di pixel dall’estremità sinistra della linea. Quindi, il numero di pixel è un marcatore per la distanza qui. Prima di tutto, dobbiamo calibrare la distanza in termini di numero di pixel.
Il telefono S-I è tenuto orizzontale e il display è tenuto ON. Un comando viene posto sullo schermo. S-II è fissato sopra S-I per catturare immagini. L’immagine dello schermo catturato è mostrata nella figura (2).
Quesito 5
La figura 3 ((a) mostra una parte dell’immagine della regola e il suo profilo di valore di luminosità lungo la linea di riferimento rossa nella figura. 3(b).
Quesito 5
a) [2 segni] Indicare il numero di pixel utilizzati dalla fotocamera di S-II per catturare un centimetro dello schermo di S-I.
(b) [5 punti] La struttura è la stessa dell’ultima parte. Successivamente, alcune piccole gocce d’acqua vengono posizionate sullo schermo di vetro di S-I accanto alla regola (vedere Fig. 4 (a) e 4 (b) per una vista superiore e laterale, rispettivamente). Modelliamo ogni goccia come l’obiettivo emisferico di raggio che ingrandisce l’array degli elementi RGB dello schermo LCD di S-I (vedi Figura. 4 ((c); la cifra non è in scala).
Quesito 5
La figura 4 ((d) mostra l’immagine ingrandita dell’archivio degli elementi RGB dello schermo visto dall’alto attraverso una delle gocce. Questa immagine viene catturata da S-II mantenendo le impostazioni della fotocamera e la distanza identiche alla parte precedente. I profili di valore luminoso delle immagini delle cinque gocce scelte lungo le linee di riferimento sono riportati nella figura. (5) nella pagina successiva.
Utilizzando le schede di profilo, scrivere il raggio della goccia d’acqua ( in mm) e la corrispondente ingrandimento () della separazione tra l’insieme degli elementi RGB di S-I per ciascuna lente di goccia d’acqua. Per riportare i dati, utilizzare la tabella della scheda Risposte riassunte. Descrivi il metodo utilizzato e i calcoli nella scheda Risposte dettagliate.
Quesito 5
c) [9 punti] Per il smartphone specificato, , gli indici di rifrazione del vetro sensibile al tatto, della goccia d’acqua e dell’aria devono essere rispettivamente , e . Utilizzando la tabella dati della parte precedente, disegnare un grafico lineare appropriato per ottenere la distanza () degli elementi RGB dal vetro sensibile al tatto. Per inserire i dati utilizzati per tracciare il grafico, utilizzare la tabella riportata nella scheda di risposte riassumere. Indicare il calcolo teorico dettagliato nella scheda delle risposte dettagliate.
Topic: Geometric Optics Metodi: Snell’s Law, Experimental Data Analysis Competenze: Experimental Data Analysis Objects: Lens, Droplet Fonte: Testo (PDF) — p.4 Soluzione: Soluzioni (PDF)