1. [8 marks] An electrifying experiment
Professor Coulomb was investigating how the magnitude of the force () between two charged spheres depends on the distance between their centres. He conducted four separate experiments by placing two identical conducting spheres 1 and 2, each of radius , at different distances from each other. The experiments are outlined in the table below. Here and are the charges on the spheres 1 and 2, respectively. The measurement results are presented in the graph.
| Experiment no. | (m) | ||
|---|---|---|---|
| 1 | 0.10 | ||
| 2 | 0.10 | ||
| 3 | 0.05 | ||
| 4 | 0.05 |
Quesito 1
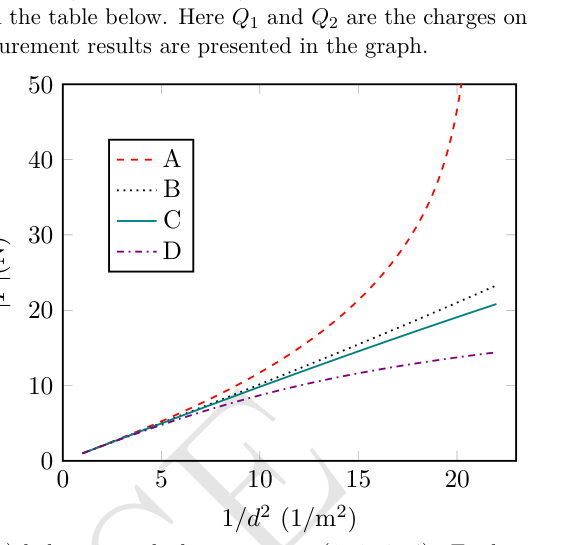
Figure out which measurement (A, B, C, D) belongs to which experiment (1, 2, 3, 4). Explain your answers in the detailed answersheet. You may draw diagrams, if necessary.
Topic: Electrostatics Metodi: Coulomb’s Law, Graph Linearization Competenze: Graph Linearization Objects: Conducting Sphere Fonte: Testo (PDF) — p.2 Soluzione: Soluzioni (PDF)
1. [8 punti] Un esperimento elettrizzante
Il professor Coulomb stava studiando come la grandezza della forza () tra due sfere cariche dipende dalla distanza tra i loro centri. Ha condotto quattro esperimenti separati posizionando due identiche sfere conduttrici 1 e 2, ciascuna di raggio , a distanze diverse l’una dall’altra. Gli esperimenti sono descritti nella tabella seguente. Qui e sono rispettivamente le spese per le sfere 1 e 2. I risultati delle misure sono riportati nel grafico.
| ♬ Esperimento no. | (m) | ||
|---|---|---|---|
| 1 | 0.10 | ||
| 2 | 0.10 | ||
| 3 | 0.05 | ||
| 4 | 0.05 |
Quesito 1
Scoprire quale misura (A, B, C, D) appartiene a quale esperimento (1, 2, 3, 4). Spiega le tue risposte nella scheda dettagliata. Se necessario, potete disegnare diagrammi.
Topic: Electrostatics Metodi: Coulomb’s Law, Graph Linearization Competenze: Graph Linearization Objects: Conducting Sphere Fonte: Testo (PDF) — p.2 Soluzione: Soluzioni (PDF)
2. A Potpourri of Prism Problems
(a) [7 marks] In the most common method to determine the angle of minimum deviation by a prism, we record the angles of deviation () for various angles of incidence () and then plot a graph. However, Professor Joseph proposed an ingenious idea to determine the angle of minimum deviation with just a single angle of incidence. Eager to share his breakthrough, he penned a letter to his friend, Professor Amal Nathan, outlining his method for an equilateral prism. According to Professor Joseph, the only tools required were four pins, a board, a marker pen or pencil, a scale, a protractor, and, of course, the prism. He even claimed that one may not need all the materials listed.
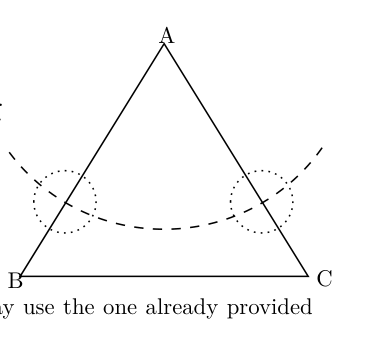
In his letter, Professor Joseph began to sketch a figure to illustrate the method. Here triangle ABC is the trace of the prism. The dashed curve is an arc of a circle centered at A. The dotted circles are centered on the points of intersection of the arc with the sides of the triangle. Unfortunately, he forgot to complete the figure. Can you describe the experimental method to determine the angle of minimum deviation using the unfinished figure of Professor Joseph? You must provide the following:
- A complete ray diagram using the given figure. You may use the one already provided on the answersheet or draw a fresh one.
- Outline of the essential experimental steps using some or all of the equipment mentioned above and nothing more. Use the detailed answer sheet for this.
Quesito 2
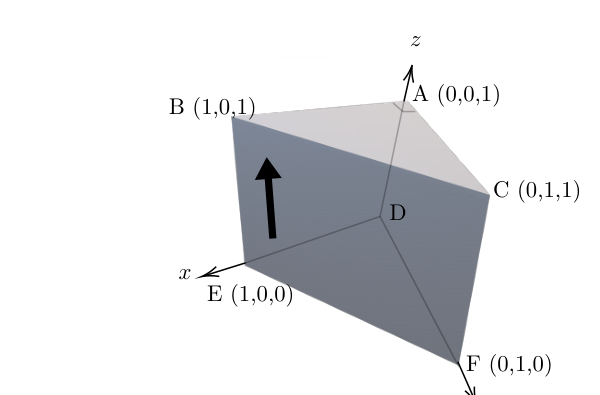
(b) [1.5 marks] Consider a right-angled isosceles prism as depicted below. The prism is placed on a table (- plane). The triangular faces are non-refracting surfaces. The refractive index of the prism is 1.50. The sides AB = AC = AD = 1 unit. The prism is positioned such that point D is at the origin, with the axes defined in the figure. An arrow-shaped object is pasted on the face BCFE of the prism as shown. Draw the image of the object as seen by an observer in front of the face BCFE.
Quesito 2
(c) [1.5 marks] Now an object, shaped like the letter “P” as illustrated in the left figure below, is held in front of the face ABED of the prism, placed on a table (- plane). The corresponding top view of this configuration is also presented in the right figure below.
Quesito 2
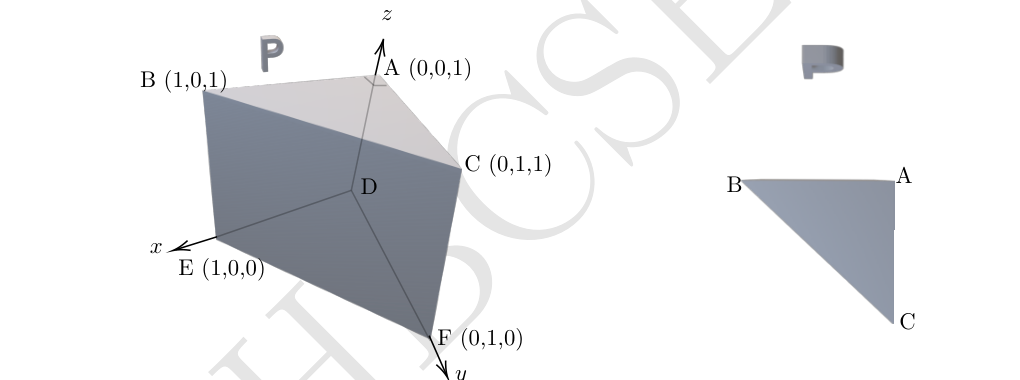
Draw the image of the “P” as seen by an observer in front the face ACFD. Additionally, draw a qualitative ray diagram illustrating the image formation.
(d) [5 marks] In this part, alongside the setup of part (c) with the prism ABCDEF and the object “P” positioned in front of its face ABED, we introduce another identical prism, A’B’C’D’E’F’ (see below).
Quesito 2
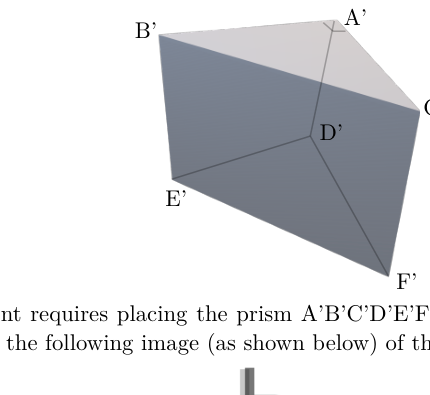
A specific experiment requires placing the prism A’B’C’D’E’F’ in combination with the existing setup so that the following image (as shown below) of the object “P” can be obtained.
Quesito 2

Without disturbing the prism ABCDEF, where and how would you hold the prism A’B’C’D’E’F’ to achieve this resultant image?
Provide your answer in terms of the coordinates of the vertices of the prism A’B’C’D’E’F’, taking vertex D of the first prism as the origin. Additionally, specify that to view such an image, the viewer should be facing which particular face of the prism.
Hint: The position of the second prism is such that any one of the parts (such as at least one of the vertices, edges, or faces) touches the table. The viewer should be positioned in a way that allows a clear line of sight to the area where the image is formed, ensuring an unobstructed view of the desired image.
(e) [3 marks] In a spectrograph, two equilateral prisms denoted as 1 and 2 with refractive indices and , respectively, are placed one after another (see the figure below). The incident ray is shown on the left and the final emergent ray is shown on the right.
Quesito 2
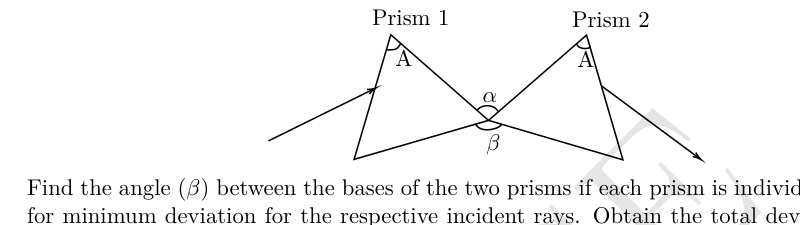
Find the angle () between the bases of the two prisms if each prism is individually adjusted for minimum deviation for the respective incident rays. Obtain the total deviation of the beam of light in this configuration. Express your answers in terms of . Calculate and in degrees.
Topic: Geometric Optics Metodi: Snell’s Law, Ray Tracing Competenze: Measurement & Instrumentation Objects: Prism Fonte: Testo (PDF) — p.2 Soluzione: Soluzioni (PDF)
2. Un Potpourri di Problemi di Prisma
(a) [7 marchi] Nel metodo più comune per determinare l’angolo di deviazione minima con un prisma, si registrano gli angoli di deviazione () per vari angoli di incidenza () e poi si disegna un grafico. Tuttavia, il professor Joseph propose un’idea ingegnosa per determinare l’angolo di deviazione minima con un solo angolo di incidenza. Desideroso di condividere la sua scoperta, scrisse una lettera al suo amico, il professor Amal Nathan, descrivendo il suo metodo per un prisma equilaterale. Secondo il professor Joseph, gli unici strumenti necessari erano quattro stivali, una tavola, una penna o una matita, una scala, un prolungatore e, naturalmente, il prisma. Egli affermò persino che non si potrebbero avere bisogno di tutti i materiali elencati.
Nella sua lettera, il professor Joseph cominciò a disegnare una figura per illustrare il metodo. Qui il triangolo ABC è la traccia del prisma. La curva tracciata è un arco di un cerchio centrato su A. I cerchi puntati sono incentrati sui punti di intersezione dell’arco con i lati del triangolo. Purtroppo, ha dimenticato di completare la figura. Puoi descrivere il metodo sperimentale per determinare l’angolo di deviazione minima usando la figura incompiuta del professor Joseph? Deve fornire quanto segue:
- Un diagramma completo dei raggi utilizzando la figura data. Potete usare quello già indicato sulla scheda di risposte o disegnare una nuova.
- Descrizione delle fasi sperimentali essenziali utilizzando parte o tutta l’attrezzatura sopra menzionata e niente di più. Per questo, utilizzare il foglio di risposta dettagliato.
Quesito 2
b) [1,5 punti] Considerate un prisma a angolo retto con isosceles come illustrato di seguito. Il prisma è posizionato su un tavolo (piano -). Le facce triangolari sono superfici non refratte. L’indice di rifrazione del prisma è di 1,50. I lati AB = AC = AD = 1 unità. Il prisma è posizionato in modo tale che il punto D sia all’origine, con gli assi definiti nella figura. Un oggetto a forma di freccia è incollato sulla facciata BCFE del prisma come mostrato. Disegnare l’immagine dell’oggetto vista da un osservatore davanti alla faccia BCFE.
Quesito 2
(c) [1,5 segni] Ora un oggetto, a forma della lettera “P” come illustrato nella figura a sinistra qui sotto, è tenuto davanti alla faccia ABED del prisma, posizionato su un tavolo (- piano). La corrispondente vista superiore di questa configurazione è presentata anche nella figura a destra qui sotto.
Quesito 2
Disegnare l’immagine della “P” vista da un osservatore davanti al viso ACFD. Inoltre, disegna un diagramma di raggi qualitativo che illustra la formazione dell’immagine.
(d) [5 segni] In questa parte, accanto all’impostazione della parte (c) con il prisma ABCDEF e l’oggetto “P” posizionato davanti alla sua faccia ABED, si introduce un altro prisma identico, A’B’C’D’E’F’ (vedere sotto).
Quesito 2
Un esperimento specifico richiede di posizionare il prisma A’B’C’D’E’F’ in combinazione con l’impostazione esistente in modo da ottenere la seguente immagine (come mostrato di seguito) dell’oggetto “P”.
Quesito 2
Senza disturbare il prisma ABCDEF, dove e come si potrebbe tenere il prisma A’B’C’D’E’F’ per ottenere questa immagine risultante?
Fornisci la tua risposta in termini di coordinate delle vertici del prisma A’B’C’D’E’F’, prendendo come origine il vertice D del primo prisma. Inoltre, specifica che per vedere una tale immagine, lo spettatore deve essere rivolto verso quale particolare volto del prisma.
Signore: La posizione del secondo prisma è tale che qualsiasi delle parti (come almeno una delle vertici, bordi o facce) tocchi il tavolo. Il visitatore deve essere posizionato in modo da consentire una chiara linea di visione verso l’area in cui si forma l’immagine, assicurando una visione senza ostacoli dell’immagine desiderata.
(e) [3 segni] In uno spettrografo, due prismi equilaterali indicati come 1 e 2 con indici di rifrazione e , rispettivamente, sono posizionati uno dopo l’altro (vedere figura seguente). Il raggio incidente è mostrato a sinistra e il raggio emergente finale è mostrato a destra.
Quesito 2
Trova l’angolo () tra le basi dei due prismi se ciascun prisma è individualmente regolato per la deviazione minima dei rispettivi raggi incidenti. Ottenere la deviazione totale del fascio luminoso in questa configurazione. Esprimere le risposte in termini di . Calcolare e in gradi.
Topic: Geometric Optics Metodi: Snell’s Law, Ray Tracing Competenze: Measurement & Instrumentation Objects: Prism Fonte: Testo (PDF) — p.2 Soluzione: Soluzioni (PDF)
3. Chandrayaan-3
On July 14, 2023, India’s lunar mission satellite, Chandrayaan-3, was successfully launched by the Indian Space Research Organization (ISRO). Chandrayaan-3 (mass ) was taken to the Moon through a series of Earth Bound Manoeuvres (elliptical) orbits (EBNs) as depicted in the figure below.
Quesito 3
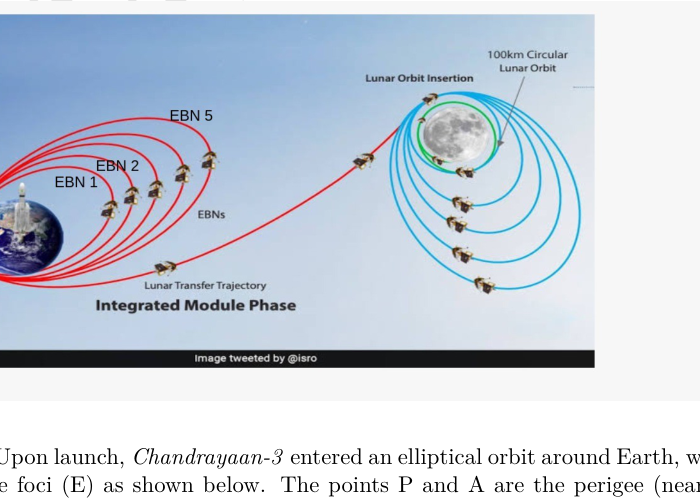
In this problem, we will explore the physics governing some part of its journey, employing a simplified model. For all parts of this problem except part (f), we consider Chandrayaan-3 to be moving only under the influence of Earth’s gravity (a central force).
(a) [6 marks] Upon launch, Chandrayaan-3 entered an elliptical orbit around Earth, with Earth at one of the foci (E) as shown below. The points P and A are the perigee (nearest point from the Earth) and apogee (farthest point from the Earth), respectively. We introduce the polar coordinate system (), where is the vector from the centre of the Earth (origin) to the satellite, and is the angle that makes with the major axis (PA ). The directions of unit vectors and are shown in the figure.
Quesito 3
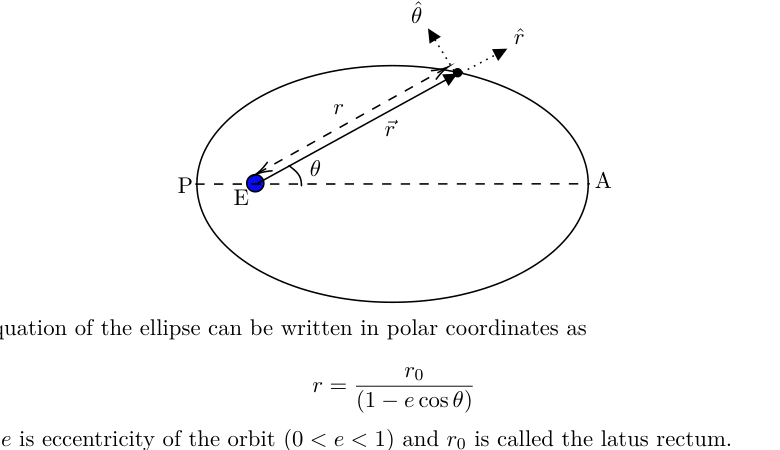
The equation of the ellipse can be written in polar coordinates as
where is eccentricity of the orbit () and is called the latus rectum. The velocity of the satellite in polar coordinates can be written as
where is the “radial” speed and is the “tangential” speed. Make schematic plots of the speeds and as functions of over one full orbit. Mark any significant points in the plots in terms of , , and other variables.
(b) [1.5 marks] Obtain an expression for the total energy () of the orbiting satellite in terms of and other constants.
(c) [1 marks] Plot the kinetic energy (KE) of the satellite as a function of over one full orbit. Mark any significant points in terms of , , and other variables.
(d) [1.5 marks] The perigee and apogee of the elliptical orbit in part (a) are 200 km and 36500 km, respectively. It is generally described as a () km orbit. Here the distances are defined from the surface of the Earth. Calculate the period of rotation (in hr) of Chandrayaan-3 in this orbit.
(e) [2.5 marks] To move Chandrayaan-3 from the first orbit (in part (d)) to another elliptical orbit EBN-1, an instantaneous boost was applied at perigee by changing the velocity by , without altering the direction. This changed the apogee to 41800 km above Earth’s surface while keeping the perigee unchanged. Calculate .
(f) [1.5 marks] After a series of manoeuvres, Chandrayaan-3 was placed in an elliptical orbit of () km around the Moon. Here, the distances are calculated from the surface of the Moon. Calculate the change in velocity , applied at the perigee, that is required to bring Chandrayaan-3 from this elliptical orbit to a circular orbit at a distance of 100 km from the surface of the Moon. For this part, assume that Chandrayaan-3 is only under the influence of the Moon’s gravitational field.
Topic: Gravitation, Astrophysics Metodi: Kepler’s Laws, Newton’s Law of Gravitation Competenze: Mathematical Modeling Objects: Satellite, Planet Fonte: Testo (PDF) — p.4 Soluzione: Soluzioni (PDF)
**3. Chandrayaan-3
Il 14 luglio 2023, il satellite lunare dell’India, Chandrayaan-3, è stato lanciato con successo dall’Organizzazione indiana per la ricerca spaziale (ISRO). Chandrayaan-3 (massa ) è stato portato sulla Luna attraverso una serie di orbite Earth Bound Manoeuvres (Eliptica) come descritto nella figura di seguito.
Quesito 3
In questo problema, esploreremo la fisica che governa una parte del suo viaggio, utilizzando un modello semplificato. Per tutte le parti di questo problema tranne la parte (f), consideriamo che Chandrayaan-3 si muova solo sotto l’influenza della gravità terrestre (una forza centrale).
(a) [6 marks] Al lancio, Chandrayaan-3 è entrata in orbita ellittica attorno alla Terra, con la Terra a uno dei foci (E) come mostrato di seguito. I punti P e A sono il perigeo (punto più vicino alla Terra) e l’apoggio (punto più lontano dalla Terra), rispettivamente. Introducendo il sistema di coordinate polari (), dove è il vettore dal centro della Terra (originario) al satellite, e è l’angolo che fa con l’asse principale (PA ). Le direzioni dei vettori unitari e sono indicate nella figura.
Quesito 3
L’equazione dell’ellisse può essere scritta in coordinate polari come
dove è l’escentricità dell’orbita () e si chiama latus rectum. La velocità del satellite in coordinate polari può essere scritta come
dove è la velocità “radial” e è la velocità “tangenziale”. Rendere diagrammi schematici delle velocità e come funzioni di su un’orbita completa. Indicare i punti significativi delle parti in termini di , e di altre variabili.
b) **[1,5 punti] ** Ottenere un’espressione dell’energia totale () del satellite in orbita in termini di e di altre costanti.
c) [1 segni] Tracciare l’energia cinetica (KE) del satellite come funzione di su un’orbita completa. Indicare i punti significativi in termini di , e di altre variabili.
d) [1,5 marchi] Il perigeo e l’apoggio dell’orbita ellittica nella parte (a) sono rispettivamente 200 km e 36500 km. Generalmente viene descritta come un’orbita () km. Qui le distanze sono definite dalla superficie della Terra. Calcolare il periodo di rotazione (in ore) di Chandrayaan-3 in questa orbita.
(e) [2,5 punti] Per spostare Chandrayaan-3 dalla prima orbita (parte (d)) verso un’altra orbita ellittica EBN-1, è stato applicato un impulso istantaneo al perigeo cambiando la velocità di , senza alterare la direzione. Questo ha cambiato l’apoggio a 41800 km sopra la superficie terrestre mantenendo il perigeo invariato. Calcolare .
(f) **[1,5 punti] ** Dopo una serie di manovre, Chandrayaan-3 è stato posizionato in un’orbita ellittica di () km intorno alla Luna. Qui le distanze sono calcolate dalla superficie della Luna. Calcolare il cambiamento di velocità , applicato al perigeo, che è necessario per portare Chandrayaan-3 da questa orbita ellittica ad un’orbita circolare a una distanza di 100 km dalla superficie della Luna. Per questa parte, supponiamo che Chandrayaan-3 sia solo sotto l’influenza del campo gravitazionale della Luna.
Topic: Gravitation, Astrophysics Metodi: Kepler’s Laws, Newton’s Law of Gravitation Competenze: Mathematical Modeling Objects: Satellite, Planet Fonte: Testo (PDF) — p.4 Soluzione: Soluzioni (PDF)
4. Mag-Grav Tussle
A rectangular conducting loop of mass , width , length , and self inductance is held in the vertical - plane with its bottom edge along the -axis (see figure on the left below). In this problem take the resistance of the loop to be zero. The region contains a uniform magnetic field (and for ), pointing out of the plane. The loop is released from rest at time and descends under gravity (see the figure to the right below). The acceleration due to gravity is in direction.
Quesito 4
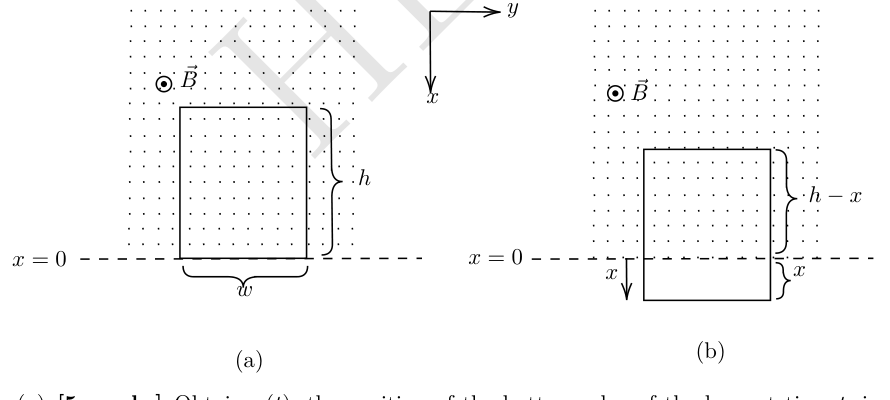
(a) [5 marks] Obtain , the position of the bottom edge of the loop at time , in terms of relevant variables.
(b) [6 marks] Imagine different possible scenarios for the nature of motion of the loop and plot for each.
Topic: Electromagnetic Induction, Newtonian Mechanics Metodi: Faraday’s Law of Induction, Differential Equations Competenze: Mathematical Modeling Objects: Coil Fonte: Testo (PDF) — p.6 Soluzione: Soluzioni (PDF)
4. Mag-Grav Tussle
Un ciclo di conduttore rettangolare di massa , larghezza , lunghezza e auto-induzione è tenuto nel piano verticale - con il suo bordo inferiore lungo l’asse (vedere figura a sinistra qui sotto). In questo problema, prendiamo che la resistenza del ciclo sia zero. La regione contiene un campo magnetico uniforme (e per ), che punta verso il piano. Il ciclo viene rilasciato dal riposo al tempo e scende sotto la gravità (vedere la figura a destra). L’accelerazione dovuta alla gravità è in direzione .
Quesito 4
a) [5 punti] Ottenere , la posizione del bordo inferiore del ciclo in tempo , in termini di variabili pertinenti.
b) **[6 punti] ** Immaginate diversi possibili scenari per la natura del movimento del ciclo e del diagramma per ciascuno.
Topic: Electromagnetic Induction, Newtonian Mechanics Metodi: Faraday’s Law of Induction, Differential Equations Competenze: Mathematical Modeling Objects: Coil Fonte: Testo (PDF) — p.6 Soluzione: Soluzioni (PDF)
5. Thermal Tussle
Consider a horizontal insulated cylindrical tube of very large length. Two identical insulated pistons, each of mass kg are fitted within the tube separated by a length m. The space between the two pistons is filled with one mole of (ideal) helium gas, initially at temperature K. The external pressure, everywhere outside the pistons and tube, is zero.
Quesito 5
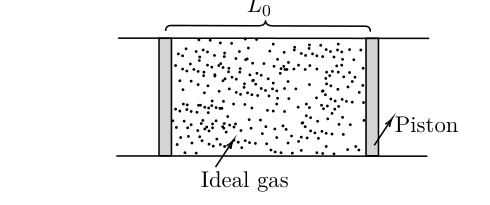
Initially, the pistons are held in place by an external mechanism. At time , the mechanism is released and the pistons move without friction and the process is quasistatic initially. Assume that the gas behaves ideally throughout. Let and be the specific heats of the gas at constant pressure and volume respectively. Also, .
(a) [6 marks] Determine the velocity () of each piston in terms of the gas temperature and other relevant variables. At what temperature (), is the process no longer quasistatic? Calculate .
(b) [4 marks] From here, we restrict our analysis only to the quasistatic regime of the process. We define . Obtain the relation between and in the following form
You may leave the answer in terms of a suitable integral involving and other variables.
(c) [4 marks] Qualitatively plot the rate of change of temperature () vs . Mark any significant point(s) on the temperature axis in the plot.
(d) [4 marks] At what time does the temperature of the gas reach 20K? What is the piston velocity () at this point?
Topic: Thermodynamics, Kinetic Theory Metodi: First Law of Thermodynamics, Differential Equations Competenze: Mathematical Modeling Objects: Cylinder, Piston, Gas Fonte: Testo (PDF) — p.6 Soluzione: Soluzioni (PDF)
5. Tussle termico
Considerate un tubo cilindrico isolato orizzontale di lunghezza molto grande. Due pistoni isolati identici, ognuno di massa kg, sono montati all’interno del tubo separato da una lunghezza m. Lo spazio tra i due pistoni è riempito da un mole di gas (ideale) di elio, inizialmente a temperatura K. La pressione esterna, ovunque fuori dai pistoni e dal tubo, è zero.
Quesito 5
Inizialmente, i pistoni sono tenuti in posizione da un meccanismo esterno. Al tempo , il meccanismo viene rilasciato e i pistoni si muovono senza attrito e il processo è inizialmente quasi-istatico. Supponiamo che il gas si comporti in modo ideale in tutto il suo tempo. La temperatura specifica del gas a pressione e volume costanti è e . Inoltre, .
a) [6 punti] Determina la velocità () di ciascun pistone in termini di temperatura del gas e di altre variabili pertinenti. A che temperatura () il processo non è più quasi-istatico? Calcolare .
b) **[4 punti] ** Da qui, la nostra analisi è limitata al regime quasi-istatico del processo. Definire . Ottenere la relazione tra e nella seguente forma
La risposta può essere lasciata in termini di un’integrale appropriata che coinvolga e altre variabili.
c) [4 segni] Grafica qualitativa del tasso di variazione della temperatura () rispetto a . Indicare qualsiasi punto significativo (s) sull’asse di temperatura del plot.
d) **[4 punti] ** A che ora la temperatura del gas raggiunge i 20K? Qual è la velocità del pistone () a questo punto?
Topic: Thermodynamics, Kinetic Theory Metodi: First Law of Thermodynamics, Differential Equations Competenze: Mathematical Modeling Objects: Cylinder, Piston, Gas Fonte: Testo (PDF) — p.6 Soluzione: Soluzioni (PDF)
6. Sonic Sleuth
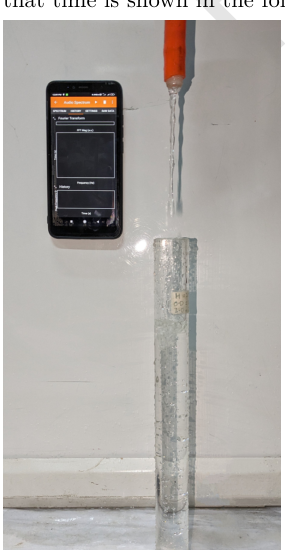
During her summer vacation, Dheera decides to carry out a smartphone based experiment. She utilizes a smartphone’s frequency sensor that can measure the frequency of the audio signal it receives. She takes a long cylindrical tube closed at one end. This tube has a length of cm and an inner diameter of cm. Dheera starts filling the tube with water, which is dripping from a tap at a rate (measured in milliliters per second (mL/s)).
Dheera positions her smartphone near the open end of the tube to measure the frequency of the sound emitted as water fills the tube. An app on the phone captures a range of frequencies in the recorded audio at any given time. At randomly chosen values of time , one of the frequencies at that time is shown in the following table.
Quesito 6
| Time (s) | Frequency (Hz) | Time (s) | Frequency (Hz) |
|---|---|---|---|
| 5.0 | 915 | 36.0 | 434 |
| 7.6 | 320 | 39.6 | 481 |
| 16.2 | 345 | 41.9 | 500 |
| 16.7 | 1008 | 42.5 | 1454 |
| 20.9 | 360 | 51.1 | 1618 |
| 25.7 | 1148 | 51.6 | 574 |
| 28.9 | 1196 | 56.1 | 1782 |
| 31.5 | 410 | 60.2 | 680 |
| 33.3 | 1290 | 66.3 | 820 |
Help her to analyse the experiment.
(a) [3 marks] Derive the expression for the velocity of sound in terms of , and constants.
(b) [8 marks] Choose a pair of suitable variables and plot a linear graph. Specify the axis labels. Obtain the speed of sound and the rate from this plot.
Topic: Oscillations & Waves Metodi: Wave Equation, Experimental Data Analysis Competenze: Experimental Data Analysis Objects: Tube Fonte: Testo (PDF) — p.7 Soluzione: Soluzioni (PDF)
6. Sonic Sleuth
Durante le sue vacanze estive, Dheera decide di eseguire un esperimento basato su smartphone. Lei utilizza il sensore di frequenza di uno smartphone che può misurare la frequenza del segnale audio che riceve. Prende un lungo tubo cilindrico chiuso da un’altra parte. Il tubo ha una lunghezza di cm e un diametro interno di cm. Dheera inizia a riempire il tubo di acqua, che scorre da un rubinetto a una velocità (misurata in millilitri al secondo (mL/s)).
Dheera posiziona il suo smartphone vicino all’estremità aperta del tubo per misurare la frequenza del suono emesso quando l’acqua riempie il tubo. Un’app sul telefono cattura una gamma di frequenze nell’audio registrato in un determinato momento. Per i valori di tempo scelti a caso , una delle frequenze di quel momento è indicata nella tabella seguente.
Quesito 6
| Time (s) | Frequency (Hz) | Time (s) | Frequency (Hz) |
|---|---|---|---|
| 5.0 | 915 | 36.0 | 434 |
| 7.6 | 320 | 39.6 | 481 |
| 16.2 | 345 | 41.9 | 500 |
| 16.7 | 1008 | 42.5 | 1454 |
| 20.9 | 360 | 51.1 | 1618 |
| 25.7 | 1148 | 51.6 | 574 |
| 28.9 | 1196 | 56.1 | 1782 |
| 31.5 | 410 | 60.2 | 680 |
| 33.3 | 1290 | 66.3 | 820 |
Aiutatela ad analizzare l’esperimento.
a) [3 punti] Derivare l’espressione per la velocità del suono in termini di e costanti.
b) [8 punti] Scegliere una coppia di variabili adatte e disegnare un grafico lineare. Specifica le etichette degli assi. Ottenere la velocità del suono e la frequenza da questo grafico.
Topic: Oscillations & Waves Metodi: Wave Equation, Experimental Data Analysis Competenze: Experimental Data Analysis Objects: Tube Fonte: Testo (PDF) — p.7 Soluzione: Soluzioni (PDF)