A block of mass is attached to a spring (one end fixed to the wall) with spring constant . The block slides on a rough horizontal table along the x-axis. Assume that both the coefficients of kinetic and static friction are same and constant . The block is initially displaced to from the unstretched position (normal length of the spring, ) of the spring and released from rest as shown below. Neglect any air resistance. Take the acceleration due to gravity to be .
\begin{document}
\begin{tikzpicture}[scale=1]
  % ground
  \draw[thick] (-0.2,0) -- (11,0);
  % wall (hatched)
  \draw[thick] (0,0) -- (0,1.4);
  \foreach \y in {0,0.2,...,1.3} {\draw (-0.25,\y) -- (0,\y+0.25);}
  % spring (coil)
  \draw[thick,decorate,decoration={coil,aspect=0.6,segment length=4mm,amplitude=3mm}] (0,0.9) -- (8.4,0.9);
  % connector to block
  \draw[thick] (8.4,0.9) -- (9.0,0.9);
  % block
  \fill[black] (9.0,0.45) rectangle (10.0,1.35);
  % unstretched position (dashed)
  \draw[dashed] (5.2,-0.3) -- (5.2,1.7);
  % x0 arrow
  \draw[->,thick] (5.2,0.25) -- (9.5,0.25);
  \node at (7.4,-0.05) {$x_0$};
  \node at (5.2,2.0) {\small unstretched position};
\end{tikzpicture}
\end{document}
(a) [3 marks] How many times will the block cross the unstretched position before coming to rest permanently?
(b) [1 marks] Determine the total distance covered by the block before coming to rest.
(c) [6 marks] Let us divide one complete oscillation of the block, starting from a fully stretched condition of the spring, into four distinct sections, requiring the following times in order: (i) : time taken for the block to move from fully stretched to the unstretched position, (ii) : time taken for the block to move from the unstretched position to fully compressed position, (iii) : time taken for the block to move from fully compressed to the unstretched position, (iv) : time taken for the block to move from the unstretched position to fully stretched position. Let the distance covered during the above intervals be , , , and , respectively. Also, let and be the time taken to complete the first and the second oscillations, respectively, starting from the initial displacement, . Compare the above times and distances by inserting an appropriate sign (from among , , or only) between the given quantities in each of the boxes below. Note that you will be penalised for 0.5 marks for giving each incorrect answer in this part. You need not to justify your answer.
(d) [2 marks] Qualitatively plot the displacement from the unstretched position vs the time .
Topic: Oscillations & Waves Metodi: Simple Harmonic Motion Analysis, Free-Body Diagram Competenze: Mathematical Modeling Objects: Block, Spring Fonte: Testo (PDF) — p.2 Soluzione: Soluzioni (PDF)
Un blocco di massa è attaccato a una molla (una estremità fissata al muro) con costante molla . Il blocco scivola su una tavolota’ orizzontale lungo l’asse x. Supponiamo che sia i coefficienti di attrito cinetico che statico siano uguali e costanti . Il blocco viene inizialmente spostato a dalla posizione non allungata (lunga normale della molla, ) della molla e rilasciato dal riposo come mostrato di seguito. Non si deve prendere in considerazione alcuna resistenza all’aria. Prendete l’accelerazione dovuta alla gravità da .
\begin{document}
\begin{tikzpicture}[scale=1]
  % ground
  \draw[thick] (-0.2,0) -- (11,0);
  % wall (hatched)
  \draw[thick] (0,0) -- (0,1.4);
  \foreach \y in {0,0.2,...,1.3} {\draw (-0.25,\y) -- (0,\y+0.25);}
  % spring (coil)
  \draw[thick,decorate,decoration={coil,aspect=0.6,segment length=4mm,amplitude=3mm}] (0,0.9) -- (8.4,0.9);
  % connector to block
  \draw[thick] (8.4,0.9) -- (9.0,0.9);
  % block
  \fill[black] (9.0,0.45) rectangle (10.0,1.35);
  % unstretched position (dashed)
  \draw[dashed] (5.2,-0.3) -- (5.2,1.7);
  % x0 arrow
  \draw[->,thick] (5.2,0.25) -- (9.5,0.25);
  \node at (7.4,-0.05) {$x_0$};
  \node at (5.2,2.0) {\small unstretched position};
\end{tikzpicture}
\end{document}
a) [3 punti] Quante volte il blocco attraverserà la posizione non allungata prima di riposare definitivamente?
b) [1 marchio] Determinare la distanza totale percorsa dal blocco prima di riposare.
(c) [6 punti] Dividiamo una oscillazione completa del blocco, a partire da una condizione completamente estesa della primavera, in quattro sezioni distinte, che richiedono i seguenti tempi in ordine: (i) : tempo necessario per il movimento del blocco dalla posizione completamente allungata alla posizione non allungata; (ii) : tempo necessario per il blocco di spostarsi dalla posizione non allungata alla posizione completamente compressa, (iii) : tempo necessario per il movimento del blocco da posizione completamente compressa a posizione non allungata; (iv) : tempo necessario per il movimento del blocco dalla posizione non allungata alla posizione completamente allungata. La distanza percorsa durante gli intervalli di cui sopra deve essere rispettivamente , , e . Inoltre, e siano il tempo necessario per completare rispettivamente le prime e le seconde oscillazioni, a partire dal spostamento iniziale, . Confronta i tempi e le distanze di cui sopra inserendo un segno appropriato (solo fra , o ) tra le quantità indicate in ciascuna delle caselle di seguito. Si noti che verrà penalizzato per 0,5 punti per ogni risposta errata in questa parte. Non devi giustificare la tua risposta.
d) [2 punti] Tracciare qualitativamente il spostamento dalla posizione non allungata rispetto al tempo .
Topic: Oscillations & Waves Metodi: Simple Harmonic Motion Analysis, Free-Body Diagram Competenze: Mathematical Modeling Objects: Block, Spring Fonte: Testo (PDF) — p.2 Soluzione: Soluzioni (PDF)
The first explosion of an atomic bomb was the Trinity test in New Mexico in 1945. This explosion released a very large amount of energy which created an expanding fireball (known as the Trinity fireball). A snapshot of this fireball taken after the explosion is shown in the photograph below.
Quesito 2
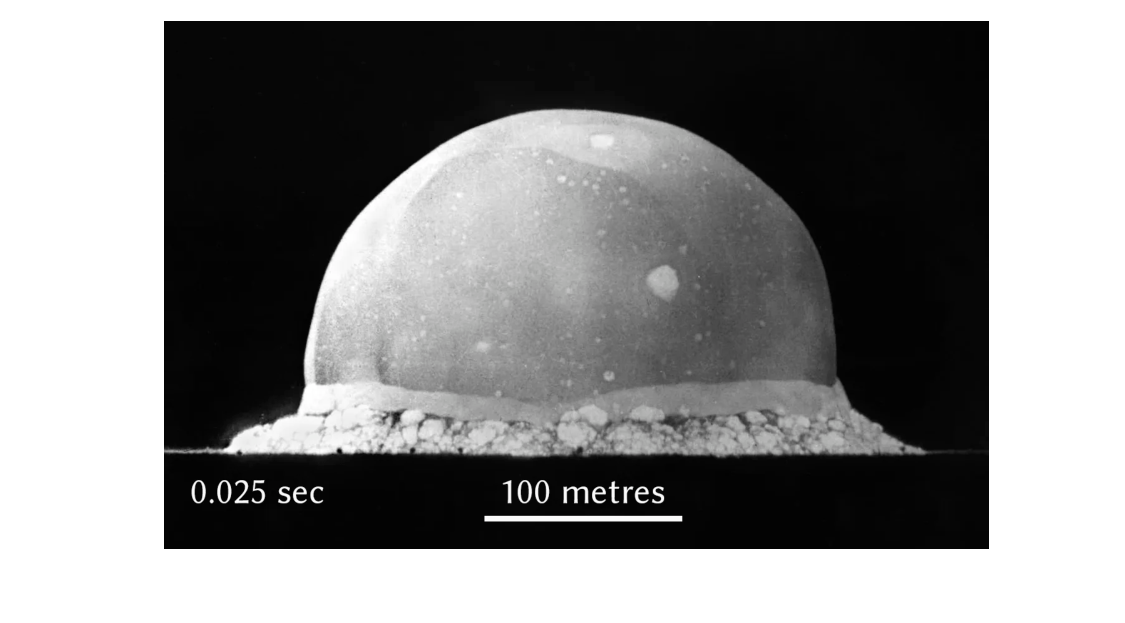
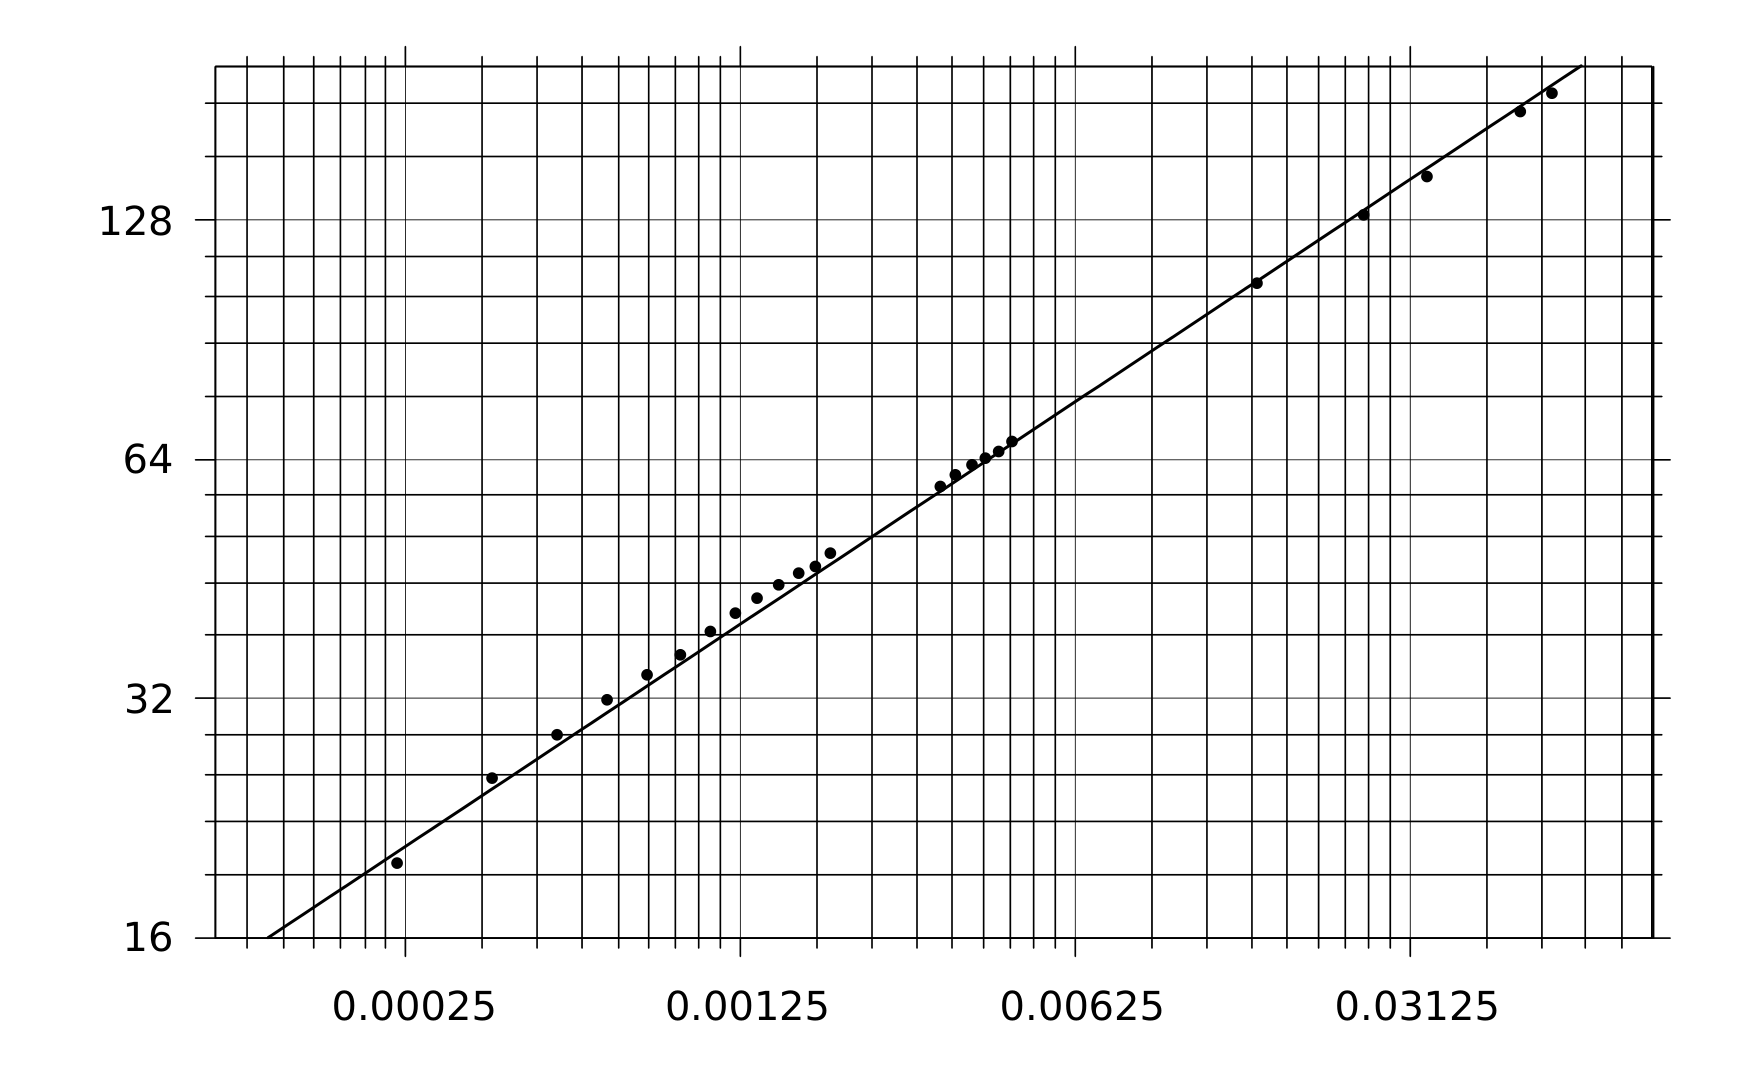
A scientist, Prof. Geoffrey Taylor, could make an estimate of the energy released by the bomb from an analysis of such photographs. Here we try to follow in his footsteps, with some suitable simplifications. To begin, we assume that the fireball is spherical in nature. Its radius () increases with time () depending on the explosion energy and the density of the surrounding air (which is taken as constant and uniform). We are also given a graph of the data obtained by Prof. Taylor, as shown below. However, the axes labels of the graph are missing.
Quesito 2
Given data: 1 kiloton (kt) of TNT = J Density of air outside the fireball = .
(a) [3 marks] What are the quantities represented by the axes of the graph? Also state the respective units in which they are expressed. In the detailed answer sheet, justify your answer.
(b) [4 marks] Find the slope () of the best fit line shown in the graph. What are the dimensions of the quantity ?
(c) [3 marks] From a dimensional analysis based on the above simplified model, make an estimate of the energy released (in kt of TNT) in the Trinity test.
Topic: Order-of-Magnitude Estimation Metodi: Dimensional Analysis, Order-of-Magnitude Estimation Competenze: Graph Linearization Objects: — Fonte: Testo (PDF) — p.2 Soluzione: Soluzioni (PDF)
La prima esplosione di una bomba atomica fu la prova della Trinità nel Nuovo Messico nel 1945. This explosion released a very large amount of energy which created an expanding fireball (known as the Trinity fireball). Una foto di questa palla di fuoco presa dopo l’esplosione è mostrata nella foto qui sotto.
Quesito 2
Uno scienziato, il Prof. Geoffrey Taylor, potrebbe fare una stima dell’energia rilasciata dalla bomba da un’analisi di tali fotografie. Qui cerchiamo di seguire le sue orme, con alcune semplificazioni appropriate. Per cominciare, supponiamo che la palla di fuoco sia di natura sferica. Il suo raggio () aumenta nel tempo () a seconda dell’energia di esplosione e della densità dell’aria circostante (che viene presa come costante e uniforme). Ci viene inoltre dato un grafico dei dati ottenuti dal Prof. Taylor, come mostrato di seguito. Tuttavia, mancano le etichette degli assi del grafico.
Quesito 2
Dati dati: 1 kiloton (kt) di TNT = J Densità dell’aria esterna alla palla di fuoco = .
(a) Quali sono le quantità rappresentate dagli assi del grafico? Indicare anche le rispettive unità in cui sono espresse. Nella scheda delle risposte dettagliate, giustifica la tua risposta.
b) [4 punti] Trova la pendenza () della linea di miglior adattamento mostrata nel grafico. Quali sono le dimensioni della quantità ?
(c) [3 punti] Basandosi su un’analisi dimensionale basata sul modello semplificato di cui sopra, si deve calcolare l’energia rilasciata (in kt di TNT) nella prova Trinity.
Topic: Order-of-Magnitude Estimation Metodi: Dimensional Analysis, Order-of-Magnitude Estimation Competenze: Graph Linearization Objects: — Fonte: Testo (PDF) — p.2 Soluzione: Soluzioni (PDF)
Consider an air filled spherical balloon comprised of elastic material of surface tension . The pressure outside the balloon is the atmospheric pressure ( kPa) and the density of air outside is . The balloon starts deflating slowly. Assume that the average velocity of air inside the balloon is negligible, and air leaves the balloon in a streamline fashion. Consider to be constant throughout, and the air to be incompressible.
(a) [8 marks] Write an expression for the time required to deflate the balloon through a small opening of cross-sectional area from an initial radius to a final radius .
(b) [1 marks] Obtain the value of this time for , , and .
Topic: Fluid Mechanics Metodi: Bernoulli’s Equation, Calculus-Integration Competenze: Mathematical Modeling Objects: Bubble Fonte: Testo (PDF) — p.3 Soluzione: Soluzioni (PDF)
Si consideri un palloncino sferico riempito di aria composto da materiale elastico di tensione superficiale . La pressione esterna del palloncino è la pressione atmosferica ( kPa) e la densità dell’aria esterna è . Il pallone inizia a deflazionarsi lentamente. Supponiamo che la velocità media dell’aria all’interno del palloncino sia trascurabile e l’aria esce dal palloncino in modo lineare. Considera che sia costante per tutto il tempo e che l’aria sia incompressibile.
a) [8 punti] Scrivere un’espressione per il tempo necessario per deflazionare il palloncino attraverso una piccola apertura di area trasversale da un raggio iniziale a un raggio finale .
b) [1 marchio] Ottieni il valore di questo tempo per , e .
Topic: Fluid Mechanics Metodi: Bernoulli’s Equation, Calculus-Integration Competenze: Mathematical Modeling Objects: Bubble Fonte: Testo (PDF) — p.3 Soluzione: Soluzioni (PDF)
A student performed an experiment to determine the acceleration due to gravity () using a simple pendulum which has a spherical bob of diameter hung with a long string. She varied the length of the string , and measured the period of oscillation every time. She calculated the value of from each measurement as shown in the table below. She noticed that not only was the average value of smaller than the expected value, each one of the measurements had yielded a value smaller than the true value. Next, she plotted a graph between and from the same data, and obtained the value of from the slope of the best fit line.
| (in cm) | (in s) | (in cm/s) |
|---|---|---|
| 20 | 0.93 | 912 |
| 40 | 1.29 | 948 |
| 60 | 1.58 | 948 |
| 80 | 1.81 | 963 |
| 100 | 2.02 | 967 |
| Average | 947 |
Quesito 4
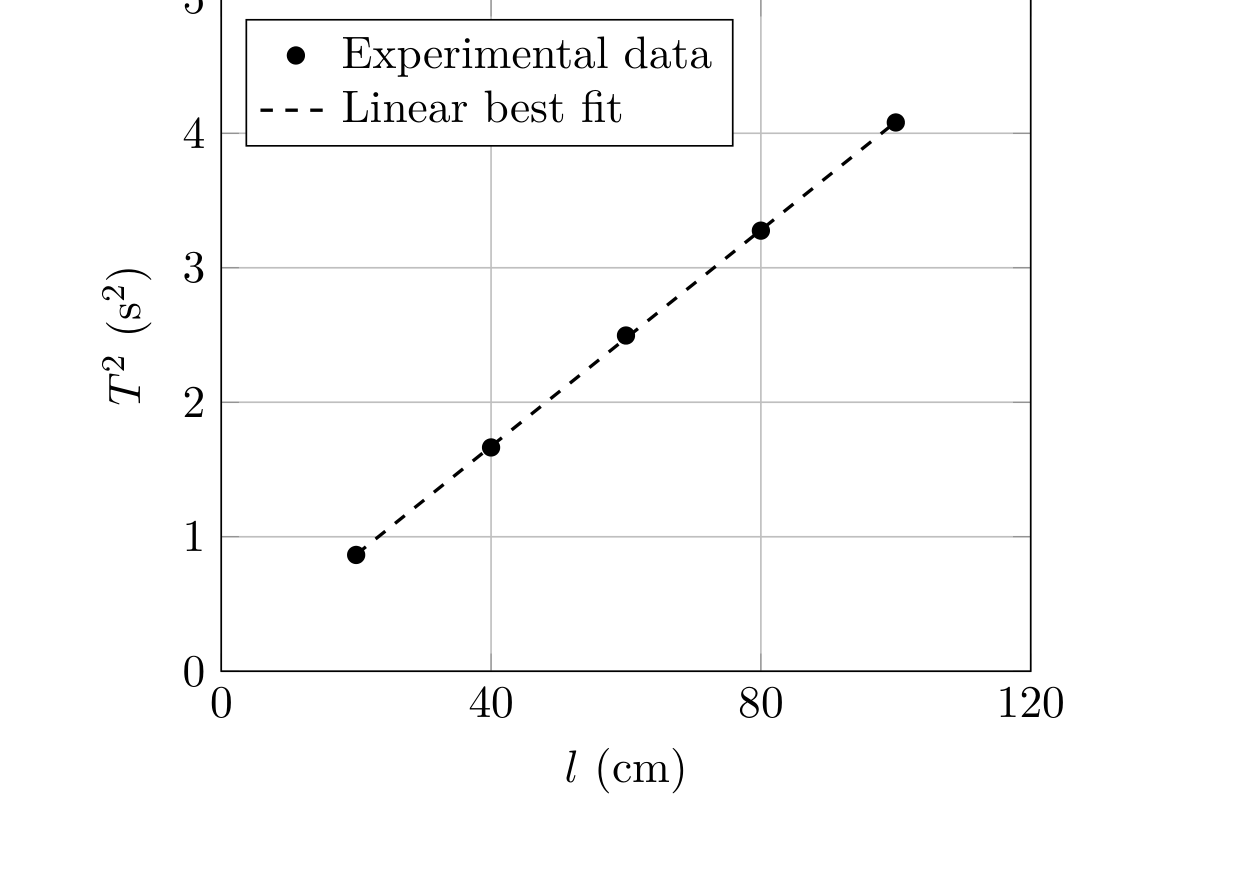
(a) [3 marks] What do you think might be the main cause for the consistently low values of that she obtained from each of her measurements?
(b) [4 marks] Explain in detail why she still obtained a correct value of from the slope of the graph plotted from the same data.
Assume that the instruments of measuring time and length were accurate enough, and all the measurements of the stated quantities were correct within the accuracy of the instruments. It is verified that the graph and the linear best fit were correctly plotted, and all numerical calculations in the above are correct. Note that you are not expected to plot any graph (no graph paper is provided to you).
Topic: Oscillations & Waves Metodi: Simple Harmonic Motion Analysis, Graph Linearization Competenze: Experimental Data Analysis Objects: Pendulum Fonte: Testo (PDF) — p.3 Soluzione: Soluzioni (PDF)
Uno studente ha eseguito un esperimento per determinare l’accelerazione dovuta alla gravità () utilizzando un semplice pendolo che ha un bobino sferica di diametro appeso con una lunga corda. Variava la lunghezza della corda , e misurò il periodo di oscillazione ogni volta. Ha calcolato il valore di da ciascuna misurazione come mostrato nella tabella seguente. Ha notato che non solo il valore medio di era inferiore al valore previsto, ma che ciascuna delle misurazioni aveva prodotto un valore inferiore al valore reale. Successivamente, ha tracciato un grafico tra e dai medesimi dati, ottenendo il valore di dalla pendenza della linea di miglior adattamento.
| (in cm) | (in s) | (in cm/s) |
|---|---|---|
| 20 | 0.93 | 912 |
| 40 | 1.29 | 948 |
| 60 | 1.58 | 948 |
| 80 | 1.81 | 963 |
| 100 | 2.02 | 967 |
| Average | 947 |
Quesito 4
(a) [3 punti] Qual è la causa principale per cui le sue misure hanno ottenuto valori costantemente bassi di ?
b) [4 punti] Spiega in dettaglio perché ha ottenuto un valore corretto di dalla pendenza del grafico tracciato dagli stessi dati.
Supponiamo che gli strumenti di misurazione del tempo e della lunghezza siano stati sufficientemente precisi e che tutte le misurazioni delle quantità indicate siano state corrette nell’ambito della precisione degli strumenti. Si verifica che il grafico e il miglior adattamento lineare siano stati tracciati correttamente e che tutti i calcoli numerici di cui sopra siano corretti. Si noti che non si prevede che si faccia un grafico (non si fornisce carta grafica).
Topic: Oscillations & Waves Metodi: Simple Harmonic Motion Analysis, Graph Linearization Competenze: Experimental Data Analysis Objects: Pendulum Fonte: Testo (PDF) — p.3 Soluzione: Soluzioni (PDF)
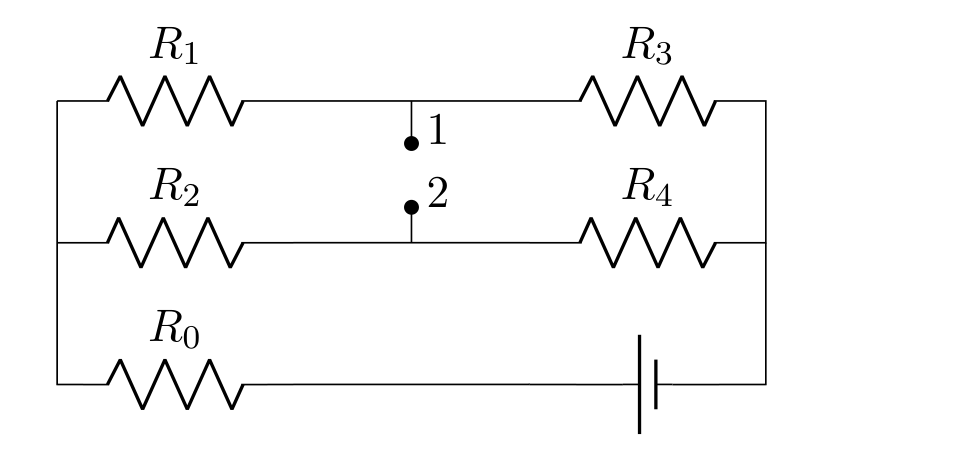
[12 marks] A circuit consists of an emf source and five resistors with unknown resistances. When an ideal ammeter is connected between points 1 and 2, its reading is . If instead a resistor is connected to the same two points, the current through that resistor is . If instead an ideal voltmeter is connected between points 1 and 2, its reading is . Obtain in terms of , and only.
Quesito 5
Topic: Circuits Metodi: Equivalent Circuit Reduction, Kirchhoff’s Laws Competenze: Mathematical Modeling Objects: Resistor, Battery Fonte: Testo (PDF) — p.4 Soluzione: Soluzioni (PDF)
Un circuito è composto da una fonte di emf e da cinque resistenti con resistenze sconosciute. Quando un ammetro ideale è collegato tra i punti 1 e 2, la lettura è . Se invece una resistenza è collegata agli stessi due punti, la corrente attraverso quella resistenza è . Se invece un voltmeter ideale è collegato tra i punti 1 e 2, la lettura è . Ottenere in termini di , e solo.
Quesito 5
Topic: Circuits Metodi: Equivalent Circuit Reduction, Kirchhoff’s Laws Competenze: Mathematical Modeling Objects: Resistor, Battery Fonte: Testo (PDF) — p.4 Soluzione: Soluzioni (PDF)