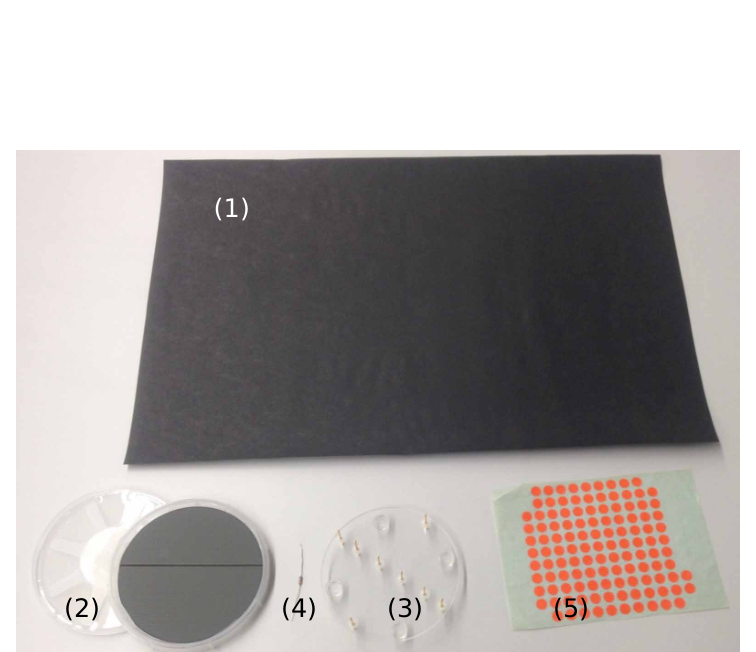
- Foglio conduttore rivestito di grafite
p.2 — Strumentazione aggiuntiva per l’esperimento
p.4 — Schema circuito sonda a quattro punte 4PP
p.6 — Barretta conduttrice tridimensionale, resistivita rho
p.6 — Lamina conduttrice bidimensionale, resistivita laminare
p.8 — Campione con contatti, configurazioni (a) e (b)

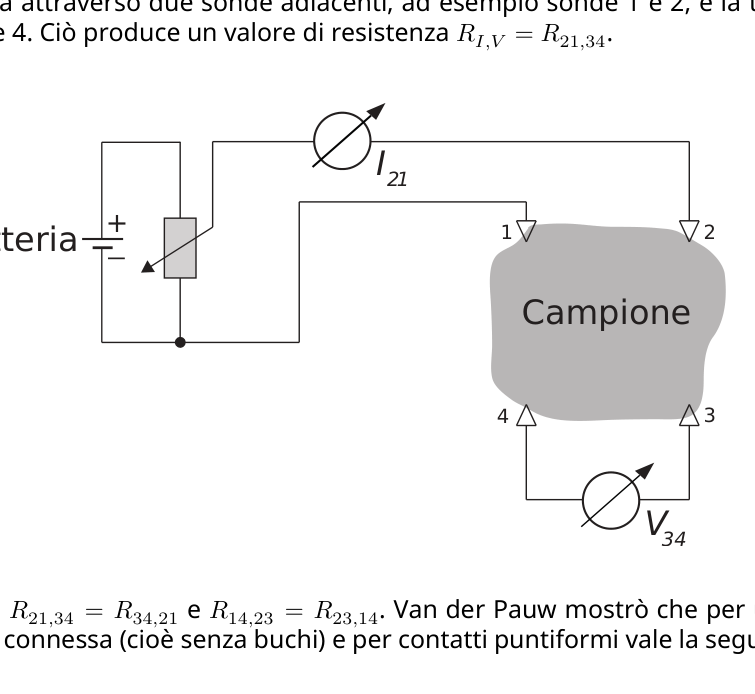
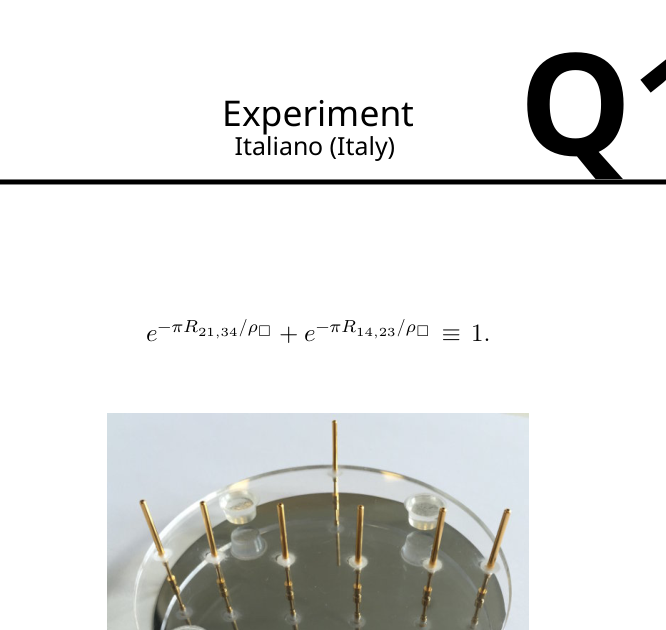
p.10 — Schema misura van der Pauw del campione
Topic: Circuits, Electrostatics, Elasticity & Materials Metodi: Physical Modeling, Experimental Data Analysis Competenze: Measurement & Instrumentation, Physical Reasoning, Experimental Data Analysis Objects: — Fonte: Testo (PDF) — p.2 Soluzione: Soluzioni (PDF)
- Lead sheet coated with graphite
The test results shall be presented in accordance with the following formula:
The following table shows the results of the tests:
Three-dimensional conductive rod, resistive rho
Other, of a kind used for the manufacture of goods of heading 8406
p.8 Contact sample, configurations (a) and (b)
The sample shall be measured in accordance with the following formula:
Topic: Circuits, Electrostatics, Elasticity & Materials Metodi: Physical Modeling, Experimental Data Analysis Competenze: Measurement & Instrumentation, Physical Reasoning, Experimental Data Analysis Objects: — Fonte: Testo (PDF) — p.2 Soluzione: Soluzioni (PDF)
- Un wafer di silicio rivestito con una sottile pellicola di cromo (contenuto in un supporto)
p.11 — Sonda 4PP sul wafer di silicio metallizzato
Topic: Circuits, Electrostatics, Elasticity & Materials Metodi: Physical Modeling, Experimental Data Analysis Competenze: Measurement & Instrumentation, Physical Reasoning, Experimental Data Analysis Objects: — Fonte: Testo (PDF) — p.2 Soluzione: Soluzioni (PDF)
- A silicon wafer coated with a thin film of chromium (contained in a support)
The test shall be carried out on the basis of the following information:
Topic: Circuits, Electrostatics, Elasticity & Materials Metodi: Physical Modeling, Experimental Data Analysis Competenze: Measurement & Instrumentation, Physical Reasoning, Experimental Data Analysis Objects: — Fonte: Testo (PDF) — p.2 Soluzione: Soluzioni (PDF)
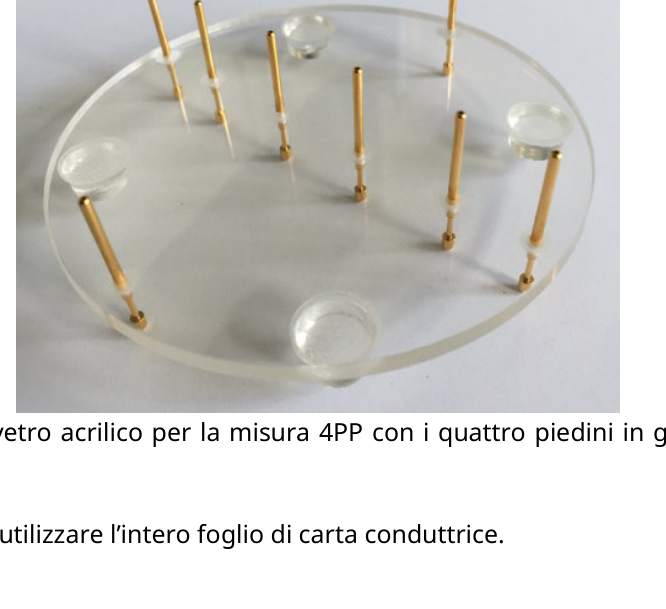
- Disco di plexiglass con 8 puntali a molla
p.4 — Disco di plexiglass con 8 puntali a molla
Topic: Circuits, Electrostatics Metodi: Physical Modeling, Experimental Data Analysis Competenze: Measurement & Instrumentation, Physical Reasoning, Diagrammatic Reasoning Objects: Disk, Spring Fonte: Testo (PDF) — p.2 Soluzione: Soluzioni (PDF)
- 8 pointed plexiglass disc
**p.4 ** 8 pointed plexiglass disc
Topic: Circuits, Electrostatics Metodi: Physical Modeling, Experimental Data Analysis Competenze: Measurement & Instrumentation, Physical Reasoning, Diagrammatic Reasoning Objects: Disk, Spring Fonte: Testo (PDF) — p.2 Soluzione: Soluzioni (PDF)
- Un resistore ohmico
Topic: Circuits, Electrostatics Metodi: Kirchhoff’s Laws, Equivalent Circuit Reduction, Physical Modeling Competenze: Diagrammatic Reasoning, Mathematical Modeling, Measurement & Instrumentation Objects: Resistor Fonte: Testo (PDF) — p.2 Soluzione: Soluzioni (PDF)
- A resistor of ohms
Topic: Circuits, Electrostatics Metodi: Kirchhoff’s Laws, Equivalent Circuit Reduction, Physical Modeling Competenze: Diagrammatic Reasoning, Mathematical Modeling, Measurement & Instrumentation Objects: Resistor Fonte: Testo (PDF) — p.2 Soluzione: Soluzioni (PDF)
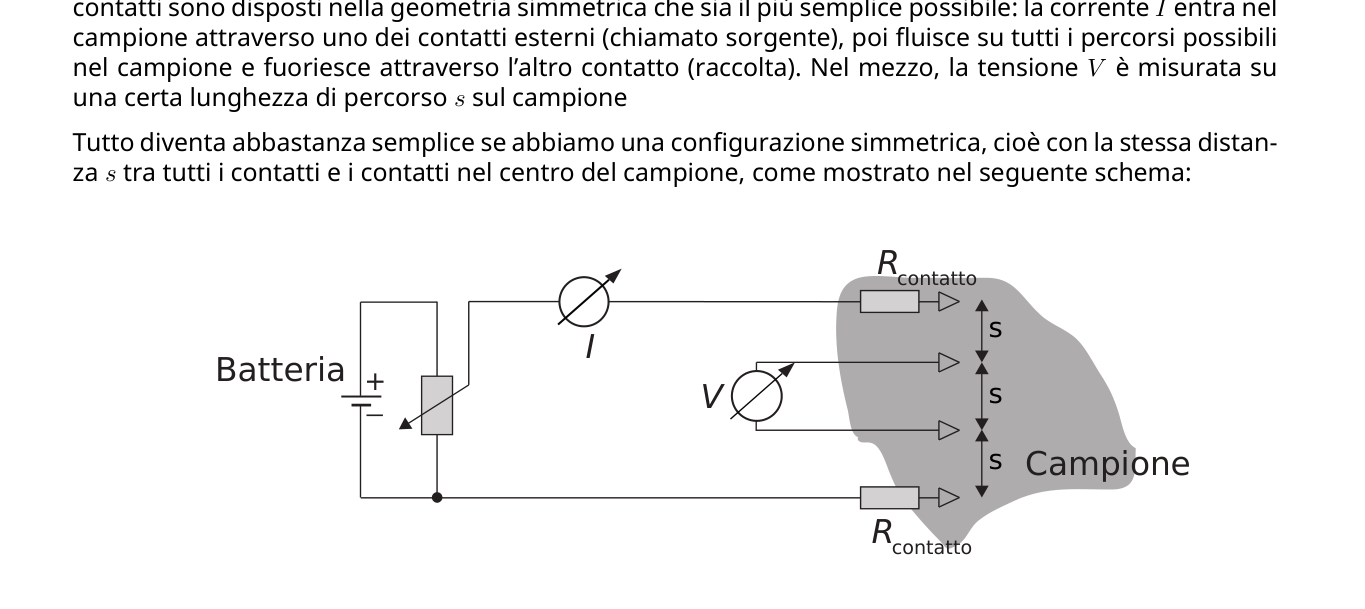
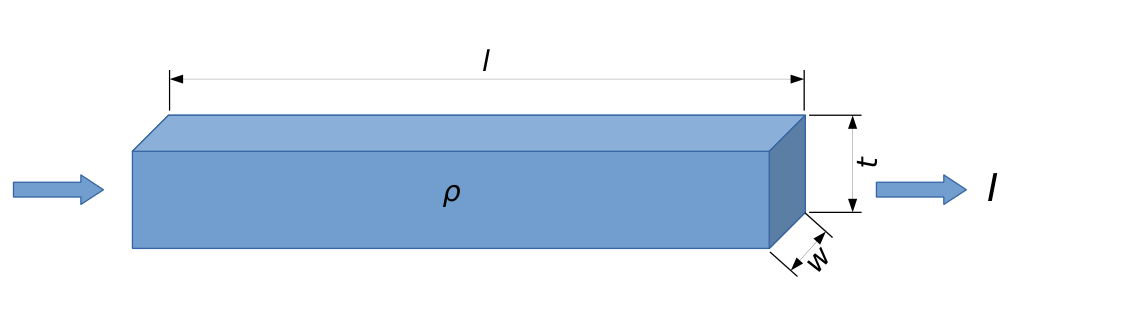
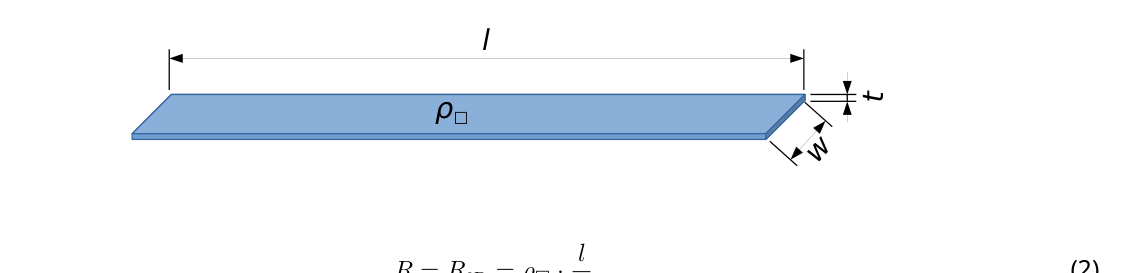
- Adesivi colorati Precauzioni importanti • Il wafer di silicio fornito può essere facilmente rotto in caso di caduta o se viene piegato . Non toccare o graffiare la superficie metallica lucida. Istruzioni • Nell’esperimento, il generatore di segnali viene utilizzato come sorgente di tensione continua. In questa modalità , il generatore di segnale dà in uscita una tensione costante tra la presa voltage (5) e la presa di terra GND (7) . I numeri si riferiscono alla fotografia mostrata nelle istruzioni di carattere generale. • La tensione (intervallo: 0-5 V ) può essere regolata con il potenziometro di sinistra etichettato adjust voltage (3) usando il cacciavite . • Quando si esegue questo esperimento, assicurarsi che la sezione del generatore di segnali che pilota l’altoparlante sia spento, usando l’interruttore (8). Questo si può verificare misurando la tensione tra la presa speaker amplitude monitor (6) e la presa di terra GND (7). Se la parte che pilota l’altoparlante è spenta, la tensione tra le due prese è zero. Experiment Italiano (Italy) Q1-3 Experiment Italiano (Italy) Q1-4 Parte A. Misure con la sonda a 4 punti (Four-point-probe- 4PP) (1.2 punti) Per misurare con precisione la resistività di un campione, i contatti utilizzati per la misura della tensione e i contatti utilizzati per iniettare la corrente devono essere separati . Questa tecnica è detta four-point-probe technique (4PP) (tecnica della sonda a quattro punti). I quattro contatti sono disposti nella geometria simmetrica che sia il più semplice possibile: la corrente Ientra nel campione attraverso uno dei contatti esterni (chiamato sorgente), poi fluisce su tutti i percorsi possibili nel campione e fuoriesce attraverso l’altro contatto (raccolta). Nel mezzo, la tensione Vè misurata su una certa lunghezza di percorso ssul campione Tutto diventa abbastanza semplice se abbiamo una configurazione simmetrica, cioè con la stessa distanza stra tutti i contatti e i contatti nel centro del campione, come mostrato nel seguente schema: V +_ Batteria I Rcontatto Campione Rcontatto s s s La curva di Irispetto a Vrappresenta la caratteristica campione e permette di determinare la resistenza di questo segmento del campione. Nel seguito useremo solo la tecnica 4PP. Per cominciare, useremo la disposizione equidistante lineare di quattro delle otto sonde (contatti) indicate nella fotografia. Figura 2: Disco di vetro acrilico per la misura 4PP con i quattro piedini in gomma e gli otto contatti o sonde. Per la seguente misura, utilizzare l’intero foglio di carta conduttrice. Experiment Italiano (Italy) Q1-5 Indicazioni importanti per tutte le misure che seguono: • Il lato lungo del foglio di carta è il lato di riferimento. Le quattro sonde devono essere allineate parallelamente a questo lato. • Fare attenzione a utilizzare il lato rivestito (nero), e non il lato posteriore marrone della carta! Si può marcare l’orientamento corretto con gli adesivi colorati. • Controllare che non ci siano buchi o tagli nella carta. • Per queste misure posizionare i contatti il più vicino possibile al centro del campione. • Premere i contatti con una forza sufficiente a garantire un buon contatto per ciascuno di essi. I piedini in plastica devono toccare la superficie. A.1 Misura con la sonda a quattro punti (4PP): misurare la differenza di potenziale Vsu un segmento di lunghezza sin funzione della corrente Iche passa lungo il segmento. Prendere in tutto almeno 4 valori, fare una tabella della differenza di potenziale Vrispetto alla corrente Inel Grafico A.1. 0.6pt A.2 Determina la resistenza R= V Iche si può ricavare dal Grafico A.1. 0.2pt A.3 Usa il Grafico A.1 per determinare l’incertezza valore di R nella misura con la tecnica 4PP 0.4pt Experiment Italiano (Italy) Q1-6 Parte B. Resistività laminare (0.3 punti) La resistività rappresenta una proprietà del materiale attraverso la quale si può calcolare la resistenza di un campione tridimensionale di date dimensioni e geometria. Qui consideriamo una barretta di lunghezza l, larghezza w e spessore t: l w t I La resistenza elettrica Rdel conduttore tridimensionale mostrato sopra è data da: R= R3D = l (1) Sulla stessa base si può definire la resistenza di un conduttore bidimensionale di spessore l w t R= R2D = w, (2) usando la resistività laminare (”rho box”). La sua unità è data in Ohm: . Importante: L’Eq. 2 è valida solo per una densità di corrente omogenea ed un potenziale costante su sezioni normali del conduttore. Nel caso di un contatto puntiforme su una superficie questo non regge. Invece si può dimostrare che la resistività della lamina è correlata alla resistenza in questo caso dalla relazione ρ□= π ln(2) (3) per l, . B.1 Calcola la resistività laminare ρ□del foglio attraverso le misure 4PP viste nella parte A. Chiameremo questo particolare valore come resistenza misurata nella parte A) perché le dimensioni del campione costituito dal foglio intero sono molto maggiori dello spazio tra i contatti s: l, . 0.3pt Experiment Italiano (Italy) Q1-7 Experiment Italiano (Italy) Q1-8 Parte C. Misure per diverse dimensioni del campione (3.2 punti) Finora le dimensioni finite del campione w e l non sono state prese in considerazione. Se il campione diventa più piccolo può portare meno corrente se la tensione è mantenuta costante: se si applica una tensione tra i due contatti puntiformi (cerchi bianchi), la corrente scorre su tutti i possibili percorsi che non si incrociano come mostrato dalle curve in figura: quanto più lunghe sono le curve tanto minore è la corrente come indicato dallo spessore delle linee. Per un campione piccolo (b) e con la stessa differenza di potenziale, la corrente totale diminuisce perché ci sono meno percorsi possibili. Così la resistenza misurata sarà maggiore: (a) (b) La resistività laminare non cambia in funzione della dimensione del campione. Così per convertire la misura di resistenza in quella di resistività, usando l’equazione 3, si deve introdurre un fattore di correzione f(w/s): ρ□= π ln(2) ) f(w/s) . (4) Per un campione di lunghezza fattore fdipende solo dal rapporto w/sed è maggiore di 1: f(w/s) . Per semplicità ci concentriamo sulla dipendenza dalla larghezza wassicurandoci solamente che il campione sia abbastanza lungo per effettuare la misura. Assumiamo che il valore si avvicini a quello corretto ρ□per grandi dimensioni: R(w/s) = ) con ) . (5) C.1 Usando il metodo 4PP, misura la resistenzae R(w, s) per 4valori w/snell’intervallo da 0.3 a 5.0 e registra i tuoi risultati nella Tabella C.1. Assicurati che la lunghezza del campione sia più grande di 5 volte la distanza tra le sonde: l> 5s e che la lunghezza ldel campione sia sempre presa lungo lo stesso lato (quello lungo) del foglio di carta. Per ogni valore di w/smisura la differenza di potenziale per 4 diversi valori di corrente e calcola la resistenza media R(w/s) dalle 4 misure. Metti i tuoi risultati nella Tabella C.1. 3.0pt C.2 Calcola f(w/s) per ognuna di queste misure 0.2pt Experiment Italiano (Italy) Q1-9 Parte D. Fattore di correzione geometrica: legge di scala (1.9 punti). Si è visto nella parte C che la resistività misurata dipende dal rapporto tra la larghezza del campione e la distanza tra le sonde w/s. Partendo dai dati acquisiti nella parte C scegliamo la seguente funzione generica per decrivere i dati nell’intervallo di misura: Funzione generica di fit: f(w/s) = 1.0 + s) b (6) Nota che per valori elevati di w/s, f(w/s) deve essere uguale a 1.0. D.1 Allo scopo di effettuare il fit della curva utilizzando l’Eq. 6 e i dati f(w/s), presi nella parte C, scegliere la carta per grafici più adeguata (lineare Grafico D.1a, semi-logaritmica Grafico D.1b, o bilogaritmica Grafico D1.c) per rappresentare i dati. 1.0pt D.2 Deduci i parametri a e b dal tuo fit. 0.9pt Experiment Italiano (Italy) Q1-10 Parte E. Il wafer di silicio e il metodo di van der Pauw (3.4 punti) Nell’industria dei semi
Topic: Circuits, Electrostatics Metodi: Experimental Data Analysis, Graph Linearization, Curve Fitting, Error Propagation Competenze: Experimental Data Analysis, Graph Linearization, Curve Fitting, Error Propagation, Measurement & Instrumentation Objects: Battery, Resistor Fonte: Testo (PDF) — p.2 Soluzione: Soluzioni (PDF)
- Other, of a width of not more than 15 mm Important precautions • The silicon wafer provided can be easily broken if it falls or is folded . I ‘m not . touch or scratch the polished metal surface. Instructions • In the experiment, the signal generator is used as a continuous voltage source. In This mode , the signal generator gives a constant voltage output between the voltage input (5) and land acquisition GND (7) . The numbers refer to the photograph shown in the instructions for The Commission’s proposal is not yet adopted. • The voltage (range: 0-5 V) can be adjusted with the left power meter labeled adjust voltage (3) using the screwdriver . • When performing this experiment, make sure that the signal generator section that The speaker driver is off, using the switch (8). This can be achieved by measuring the voltage between the speaker amplitude monitor socket (6) and the ground GND socket (7). If the pilot part The speaker is off, the voltage between the two sockets is zero. Experiments Italian (Italy) Q1-3 Experiments Italian (Italy) Q1-4 Part A. Measurements with the four-point probe (4PP) (1.2 points) For accurate measurement of the resistivity of a sample, the contacts used for measuring the voltage and the contacts used to inject the current must be separated . This technique is called four-point-probe technique (4PP) (four-point probe technique). The four The contact is arranged in a symmetrical geometry that is as simple as possible: the current enters the sample through one of the external contacts (called source), then flow over all possible paths In the sample and out through the other contact (harvest). In the middle, the voltage is measured on a certain path length on the sample It all becomes pretty simple if we have a symmetric configuration, that is, with the same distance from all the contacts and contacts in the center of the sample, as shown in the following diagram: V +_ Other I I ‘m in touch . Sample I ‘m in touch . s s s The Irispectus curve to represents the sample characteristic and allows the determination of the the resistance of this segment of the sample. We will only use 4PP in the following. For starters, We’ll use the linear equidistant arrangement of four of the eight probes (contacts) shown in the photo. Figure 2: Acrylic glass disc for 4PP measurement with four rubber feet and eight contact or probe. For the following measurement, use the entire sheet of lead paper. Experiments Italian (Italy) Q1-5 Important information for all of the following measures: • The long side of the sheet is the reference side. The four probes must be aligned. parallel to this side. • Be careful not to use the brown back of the paper, but the coated (black) side! You can mark the correct orientation with coloured stickers. • Check that there are no holes or cuts in the paper. • For these measures, place the contacts as close as possible to the centre of the sample. • Press contacts with sufficient force to ensure good contact for each of them. I plastic feet must touch the surface. A.1 Measurement with the four-point probe (4PP): Measurement of the potential difference On a segment of length without current function I which passes along the segment. Take at least four values in total, make a table of the difference of potential V to current Inel Graph A.1. 0.6pt A.2 Determine the resistance R=V The data can be obtained from Chart A.1. 0.2pt A.3 Usa il Grafico A.1 per determinare l’incertezza valore di R nella misura with 4PP technique 0.4pt Experiments Italian (Italy) Q1-6 Part B. Laminated resistivity (0.3 points) Resistivity is a property of the material through which the resistance can be calculated of a three-dimensional sample of given dimensions and geometry. Here we consider a bar of length l, width w and thickness t: l w t I The electrical resistance R of the three-dimensional conductor shown above is given by: R= R3D = l (1) On the same basis, the resistance of a two-dimensional conductor of thickness can be defined. l w t R= R2D = w, (2) using the laminar resistivity (rho box). Its unit is given in Ohm: . I’m not sure. 2 is valid only for a homogeneous current density and a constant potential on normal sections of the driver. In the case of pointed contact on a surface, this does not hold. The resistance of the sheet is related to the resistance in this case by the Report by the Commission ρ□= π ln(2) (3) for l, . B.1 The laminar resistivity ρ□ of the sheet is calculated using the 4PP measures shown in Part A. Chiameremo questo particolare valore come resistenza measured in Part A) because the sample size of the sheet The whole is much larger than the space between the contacts s: l, . 0.3pt Experiments Italian (Italy) Q1-7 Experiments Italian (Italy) Q1-8 Part C. Measurements for different sample sizes (3.2 points) So far the finite dimensions of the sample w and l have not been taken into account. If the sample If the voltage is maintained constant, it can lead to less current. The voltage between the two point-form contacts (white circles), the current flows over all possible paths that The longer the curves are the smaller the curve is the smaller the curve. current as indicated by the thickness of the lines. For a small sample (b) and with the same difference The total current decreases because there are fewer possible paths. So the resistance measured shall be greater: (a) (b) The laminar resistivity does not change according to the sample size. So to convert the resistance measure to the resistance measure, using equation 3, you have to introduce a correction factor f(w/s): ρ□= π ln(2) ) f(w/s) . (4) For a length sample the f-factor depends only on the w/sed ratio greater than 1: f(w/s) . We simply focus on the dependence on width and we only make sure that we are the sample is long enough to be measured. Let’s assume that the value is close to that. corrected ρ□ for large sizes: R(w/s) = ) with ) . (5) C.1 Using the 4PP method, measure the resistance and R(w, s) by 4 values w/speed ranging from 0.3 to 5.0 and record your results in Table C.1. Make sure that the length of the sample greater than 5 times the distance between the probes: l> 5s The length of the sample is always taken along the same side (that is, the length of the sample is always taken along the same side). length) of the paper. For each w/smix value the difference in potential for 4 different values of current and calculates the average resistance R(w/s) from the 4 measurements. Put your results in . in Table C.1. 3.0pt C.2 Calculate f(w/s) for each of these measures 0.2pt Experiments Italian (Italy) Q1-9 The following is the list of the following: Geometric correction factor: law of scale (1.9 points). It was seen in Part C that the measured resistivity depends on the ratio of sample width and the distance between the w/s probes. Based on the data in Part C, we choose the following function: Generic to describe data in the measurement range: General fit function: f(w/s) = 1.0 + s) b (6) Note that for high values of w/s, f(w/s) must be equal to 1.0. D.1 For the purpose of making the curve fit using the Eq. 6 and data f(w/s), taken In Part C, choose the most appropriate chart paper (linear Chart D.1a, The following table shows the number of units of the unit of measurement used: The data. 1.0pt D.2 Subtract parameters a and b from your fit. 0.9pt Experiments Italian (Italy) Q1-10 Part E. The silicon wafer and the van der Pauw method (3.4 points) In the seed industry
Topic: Circuits, Electrostatics Metodi: Experimental Data Analysis, Graph Linearization, Curve Fitting, Error Propagation Competenze: Experimental Data Analysis, Graph Linearization, Curve Fitting, Error Propagation, Measurement & Instrumentation Objects: Battery, Resistor Fonte: Testo (PDF) — p.2 Soluzione: Soluzioni (PDF)