- Altoparlante assemblato con un cilindro di plastica montato nella parte superiore
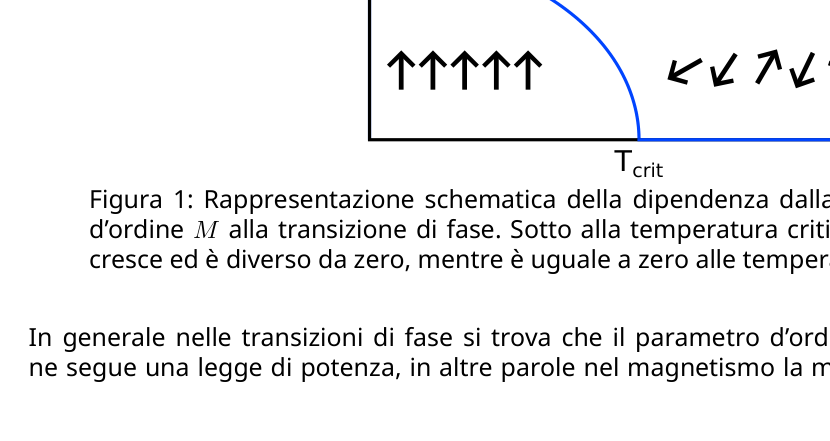
p.1 — Parametro d’ordine M in funzione di T
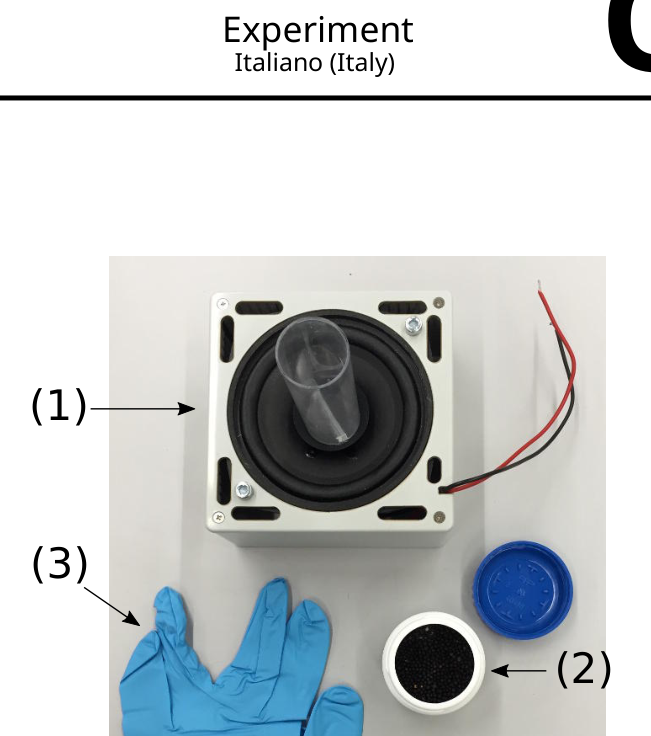
p.3 — Strumentazione del materiale dell’esperimento
Topic: Oscillations & Waves Metodi: Physical Modeling Competenze: Measurement & Instrumentation Objects: Membrane, Cylinder Fonte: Testo (PDF) — p.3 Soluzione: Soluzioni (PDF)
- Other, of a kind used for the manufacture of goods of heading 8406
The following is the list of the parameters of the M order function of T:
The test results shall be presented in accordance with the following formula:
Topic: Oscillations & Waves Metodi: Physical Modeling Competenze: Measurement & Instrumentation Objects: Membrane, Cylinder Fonte: Testo (PDF) — p.3 Soluzione: Soluzioni (PDF)
- Circa 100 semi di papavero (in un recipiente di plastica)
Topic: Oscillations & Waves Metodi: Physical Modeling Competenze: Measurement & Instrumentation Objects: Container Fonte: Testo (PDF) — p.3 Soluzione: Soluzioni (PDF)
- About 100 poppy seeds (in a plastic container)
Topic: Oscillations & Waves Metodi: Physical Modeling Competenze: Measurement & Instrumentation Objects: Container Fonte: Testo (PDF) — p.3 Soluzione: Soluzioni (PDF)
- Un guanto
Topic: Oscillations & Waves Metodi: Physical Modeling Competenze: Measurement & Instrumentation Objects: — Fonte: Testo (PDF) — p.3 Soluzione: Soluzioni (PDF)
- A glove
Topic: Oscillations & Waves Metodi: Physical Modeling Competenze: Measurement & Instrumentation Objects: — Fonte: Testo (PDF) — p.3 Soluzione: Soluzioni (PDF)
- Nastro adesivo Precauzioni importanti • Non applicare una forza laterale eccessiva sul cilindro di plastica montato sull’altoparlante. Si noti che non saranno forniti dispositivi di riserva in caso di membrane degli altoparlanti strappate o staccate dal cilindro di plastica. • Spegnere il gruppo dell’altoparlante quando non in uso, al fine di evitare un inutile consumo della batteria. • In questo esperimento, sui morsetti per l’altoparlante situati sul generatore di segnali è disponibile in uscita un segnale a dente di sega di 4 Hz. • L’ampiezza del segnale a dente di sega può essere regolata usando il corretto potenziometro etichettato come ampiezza altoparlante (4). Una tensione continua proporzionale all’ampiezza di segnale viene emessa sulla presa ampiezza altoparlante (6) (rispetto alla presa GND (7)). I numeri si riferiscono alla fotografia (figura 2) indicata nelle istruzioni di carattere generale. • La membrana dell’altoparlante è delicata. Assicurarsi di non applicare una pressione eccessiva su di essa con qualsiasi mezzo sia in verticale che laterale. Experiment Italiano (Italy) Q2-4 Experiment Italiano (Italy) Q2-5 Parte A. Ampiezza di eccitazione critica (3.3 punti) Prima di iniziare i compiti reali di questo problema, collega l’altoparlante ai terminali sul lato del generatore di segnali (assicurarsi di utilizzare la polarità corretta). Mettere alcuni (ad esempio 50) semi di papavero nel cilindro montato sull’altoparlante e utilizzare un pezzo tagliato dal guanto fornito per chiudere il cilindro in alto per mantenere i semi di papavero nel cilindro. Accendere l’eccitazione utilizzando l’interruttore e regolare l’ampiezza ruotando il corretto potenziometro etichettato ampiezza altoparlante (4) usando il cacciavite fornito. Osservare lo smistamento delle perline provando diverse ampiezze. Il primo compito è quello di determinare l’eccitazione di ampiezza critica di questa transizione. Per fare questo, è necessario determinare il numero di perline N1 e N2 nei due scomparti (scegliendo i nomi dei due vani in modo che N1 ) in funzione dell’ampiezza ADvisualizzata, che è la tensione misurata nella presa ampiezza dell’altoparlante (6). Questa tensione è proporzionale all’ampiezza della forma d’onda a dente di sega che pilota l’altoparlante. Fare almeno 5 misurazioni per ogni valore della tensione. Suggerimento: • Al fine di avere sempre un movimento nelle particelle che studi, indagare solo ampiezze corrispondenti alla tensione ampiezza altoparlante superiore a 0.7 V. Iniziare analizzando il comportamento del sistema semplicemente variando la tensione lentamente senza alcun conteggio delle perline. Può essere che alcune delle perline rimangano attaccate alla base a causa di fenomeni di elettrostatica. Non contare queste perline. A.1 Annota nella Tabella A.1 i tuoi conteggi del numero di particelle N1 e N2 in ciascuna metà del recipiente per varie ampiezze AD. 1.2pt A.2 Calcola la deviazione standard delle tue misure di N1 e N2 e riporta il risultato nella Tabella A.1. Costruisci nel Grafico A.2 un grafico di N1 e di N2 in funzione dell’ampiezza mostrata AD, includendo le loro incertezze sperimentali. 1.1pt A.3 Basandoti sul tuo grafico, determina l’ampiezza mostrata critica AD,crit per la quale N1 = N2, dopo aver atteso fino a quando viene raggiunto uno stato stazionario. 1pt Parte B. Calibrazione (3.2 punti) L’ampiezza mostrata ADcorrisponde ad una tensione applicata all’altoparlante. Tuttavia, la quantità fisicamente interessante è il massimo spostamento Adell’oscillazione dell’altoparlante, in quanto questo si collega a quanto fortemente le perline sono eccitate. Pertanto, è necessario calibrare l’ampiezza visualizzata. A questo scopo, è possibile utilizzare qualsiasi materiale e strumenti che ti sono stati forniti. B.1 Rappresentare la configurazione utilizzata per misurare l’ampiezza di eccitazione, cioè la distanza massima A(in mm) percorsa dall’altoparlante in un periodo di oscillazione. 0.5pt B.2 Determinare l’ampiezza Ain mm per un numero opportuno di punti, cioè registrare nella Tabella B.2 l’ampiezza Ain funzione dell’ampiezza mostrata ADe indicare le incertezze sperimentali delle tue misurazioni. 0.8pt Experiment Italiano (Italy) Q2-6 B.3 Riporta i tuoi dati nel Grafico B.3, incluse le incertezze sperimentali. 1.0pt B.4 Determina i parametri della curva risultante, usando un adeguato fit per determinare la funzione di calibrazione A(AD). 0.8pt B.5 Determina l’ampiezza di eccitazione critica Acrit dei semi di papavero. 0.1pt Parte C. Esponente critico (3.5 punti) Nel nostro sistema, la temperatura corrisponde all’energia cinetica fornita dall’eccitazione. Questa energia è proporzionale al quadrato della velocità dell’altoparlante, cioè a v2 = A2f2 , dove fè la frequenza dell’oscillazione. Noi ora analizzeremo questa dipendenza e determineremo l’esponente bdella legge di potenza che regola il comportamento del parametro d’ordine (vedi Eq. 1). C.1 La grandezza non equilibrata N1+N2 ∣è un buon candidato per un parametro d’ordine per il nostro sistema poiché vale zero sopra l’ampiezza critica ed è uguale a 1 a bassa eccitazione. Determinare questo parametro d’ordine in funzione dell’ampiezza A. Registra i tuoi risultati nella Tabella C.1. 1.1pt C.2 Rappresenta nel Grafico C.2 la grandezza non equilibrata N1+N2 ∣in funzione di ∣A2 crit , in cui entrambi gli assi hanno scale logaritmiche (scala bilogaritmica). È possibile utilizzare la Tabella C.1 per i calcoli. I punti sul grafico possono sembrare non obbedire ad una relazione lineare, ma ciò nonostante deve essere eseguita una regressione lineare al fine di determinare l’esponente critico della formula. 1pt C.3 Determinare l’esponente be stimare l’incertezza. 1.4pt
Topic: Oscillations & Waves, Newtonian Mechanics, Thermodynamics Metodi: Experimental Data Analysis, Graph Linearization, Curve Fitting, Statistical Averaging Competenze: Experimental Data Analysis, Graph Linearization, Error Propagation Objects: Membrane, Cylinder Fonte: Testo (PDF) — p.3 Soluzione: Soluzioni (PDF)
- Other, of a kind used for the manufacture of goods of heading 810 Important precautions • Do not apply excessive lateral force to the plastic cylinder mounted on the speaker. Please note which will not be provided with spare devices in case of torn speaker membranes; or They’re cut off from the plastic cylinder. • Turn off the speaker group when not in use to avoid unnecessary use of the speaker I’m not going to get a battery. • In this experiment, the speaker handles located on the signal generator are available a 4 Hz saw-tooth signal is output. • The width of the saw tooth signal can be adjusted using the correct power meter labeled as speaker width (4). A continuous voltage proportional to the signal width shall be emitted on the speaker width socket (6) (as compared to the GND socket (7)). The numbers are refer to the photograph (Figure 2) in the general instructions. • The speaker membrane is delicate. Make sure you don’t put too much pressure on your of it by any means, either vertically or sideways. Experiments Italian (Italy) Q2-4 Experiments Italian (Italy) Q2-5 Part A. Critical excitation amplitude (3.3 points) Before you start the actual tasks of this problem, connect the speaker to the terminals on the signal generator side (make sure you use the correct polarity). Put some (e.g. 50) seeds of poppy seed in the cylinder mounted on the speaker and use a cut piece from the provided glove to close the cylinder up to keep the poppy seed in the cylinder. Turn on the excitation using The switch and the amplitude adjustment by rotating the correct power meter (4) using the provided crusher. Observe the arrangement of the beads by testing different amplitudes. The first task is to determine the critical scale of excitement of this transition. To do This is the case for the number of N1 and N2 beads in the two compartments (selecting the names of the two valves so that N1 ) depending on the ADV displayed, which is the voltage measured in the The length of the speaker is not less than 6 minutes. This voltage is proportional to the waveform width of the wave The tooth of a saw that drives the speaker. At least 5 measurements per voltage value shall be made. I suggest you: • To always have movement in the particles you study, only investigate amplitudes corresponding to the speaker amplitude voltage greater than 0.7 V. Start by analyzing the behavior of the system simply by varying the voltage slowly without any counting of the beads. Some of the beads may remain attached to the base due to phenomena of The electrostatic system. Don’t count these beads. A.1 Please note in Table A.1 your counts of the number of particles N1 and N2 in each half of the container for different AD amplitudes. 1.2pt A.2 Calculate the standard deviation of your measurements of N1 and N2 and report the result in Table A.1. In Chart A.2 build a functional chart of N1 and N2 The Commission’s proposal for a directive on the approximation of the laws of the Member States on the approximation of the laws of the Member States relating to the approximation of the laws of the Member States on the approximation of the laws of the Member States on the approximation of the laws of the Member States on the approximation of the laws of the Member States on the approximation of the laws of the Member States on the approximation of the laws of the Member States on the approximation of the laws of the Member States on the approximation of the laws of the Member States on the approximation of the laws of the Member States on the approximation of the laws of the Member States on the approximation of the laws of the Member States on the approximation of the laws of the Member States on the approximation of the laws of the Member States on the approximation of the laws of the law of the Member States on the approximation of the laws of the law of the Member States on the approximation of the law of the law of the law of the Member States on the 1.1pt A.3 Based on your chart, determine the critical display width AD, written for the where N1 = N2, after waiting until a state is reached The stationary. 1pt Part B. The following shall be added: The amplitude shown AD corresponds to a voltage applied to the speaker. However, the quantity of physical interest is the maximum displacement of the speaker’s oscillation, as this is linked to how strongly the beads are excited. Therefore, the width should be calibrated The display. To this end, you can use any material and tools that have been provided to you. B.1 Represent the configuration used to measure the amplitude of excitation, i.e. the maximum distance A(in mm) travelled by the speaker in a period of time of oscillation. 0.5pt B.2 Determine the Ain mm width for an appropriate number of points, i.e. record in Table B.2 the Ain width function of the width shown ADe indicate the experimental uncertainties of your measurements. 0.8pt Experiments Italian (Italy) Q2-6 B.3 Report your data to Graph B.3, including experimental uncertainties. 1.0pt B.4 Determine the parameters of the resulting curve using an appropriate fit for determine the calibration function A(AD). 0.8pt B.5 It determines the extent of critical excitation of poppy seed acrit. 0.1pt Part C. Critical exposure (3.5 points) In our system, the temperature corresponds to the kinetic energy provided by the excitation. This energy is proportional to the square of the speaker’s speed, i.e. at v2 = A2f2, where the frequency The oscillation. We will now analyse this dependence and determine the law of the The power which regulates the behavior of the order parameter (see Eq. 1). C.1 The unbalanced size N1+N2 is a good candidate for a parameter of order for our system as it is zero above critical width and It’s equal to 1 at low excitement. Determine this order parameter in function of width A. Record your results in Table C.1. 1.1pt C.2 In Chart C.2 it represents the unbalanced magnitude N1+N2 in function of ∣A2 Crit , where both axes have logarithmic scales (bialogarithmic scale). Table C.1 may be used for calculations. The points on the graph can The results of the analysis of the data are presented in the following table: The formula. 1pt C.3 Determine the respondent and estimate the uncertainty. 1.4pt
Topic: Oscillations & Waves, Newtonian Mechanics, Thermodynamics Metodi: Experimental Data Analysis, Graph Linearization, Curve Fitting, Statistical Averaging Competenze: Experimental Data Analysis, Graph Linearization, Error Propagation Objects: Membrane, Cylinder Fonte: Testo (PDF) — p.3 Soluzione: Soluzioni (PDF)