Problem 1 (10 points) — Ice-cold research
Samples from the depths of the Arctic and Antarctic ice sheets can provide insight into the climate of times long past. During the drillings in the NEEM project (North Greenland Eemian Ice Drilling), ice-core samples from the central ice sheet were obtained in Greenland from depths of over 2500 m. The uppermost layers of the Greenland ice sheet consist of so-called firn snow, which is compressed into ice with increasing depth. The graph shown below depicts the density in the uppermost part of the Greenland ice sheet as a function of the depth below the surface.
Consider a sample from the ice core that has approximately the shape of a cylinder with diameter and height . The mass of the sample is .
1.a) Calculate the approximate density of the sample and determine from which depth of the ice sheet it originates.
In reality, the sample is not perfectly cylindrical, which introduces errors in the density determination. An alternative method for determining the density avoids this problem.
For this, a beaker is filled with water and placed on a balance. The sample is then placed into the beaker so that it floats in the water. Finally, the sample is pushed underwater with a pointed object. The masses indicated by the balance in these three situations are (beaker with water), (with the sample added), and (with the sample pushed down).
1.b) Using this, determine a more accurate value for the density of the sample and the depth of the sampling. Make no assumption about the shape of the sample, and use the value for the density of water.
By examining chemical impurities and isotope ratios, the thickness of the annually deposited ice layers in the ice core can be determined. Under pressure, ice exhibits properties of a fluid. Therefore the ice in the Greenland ice cover is not only compressed but also moves from the ice shelf toward the coasts. This causes the annually deposited ice layers to become thinner with increasing depth. The following table gives the thickness of the ice layers in metres per year for the NEEM core:
| Depth in m | Thickness per year in m a |
|---|---|
| 0 | 0.25 |
| 500 | 0.20 |
| 1000 | 0.13 |
| 1200 | 0.10 |
| 1400 | 0.037 |
| 1500 | 0.018 |
| 1600 | 0.010 |
1.c) Using the data from the table, construct a graph that approximately shows the age of an ice sample as a function of the depth of the sampling.
1.d) Using this, determine the age and of two ice-core samples taken at depths of and .
Examination of the samples allows conclusions to be drawn about climate changes. An important indicator for this is the quantity , which compares the ratio of the stable oxygen isotopes to in the ice with a reference value. Studies of the Greenland ice layer show that there is an approximately linear relationship between this quantity and the temperature above the ice layer. For the two samples examined, the values are and .
1.e) Determine approximately the temperatures and that prevailed above the ice layer at the time the two ice samples formed, and calculate the difference between the temperatures.
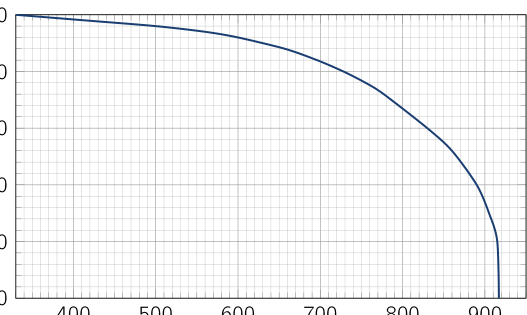 Density vs. depth in the NEEM ice core
Topic: Thermodynamics, Fluid Mechanics, Modern-Quantum Physics Metodi: Experimental Data Analysis, Hydrostatic Equilibrium, Graph Linearization Competenze: Experimental Data Analysis, Graph Linearization Objects: Cylinder, Container Fonte: Testo (PDF) — p.1
Problem 1 (10 points) — Ice-cold research
I campioni delle profondità dei ghiacci dell’Artico e dell’Antartide possono fornire informazioni sul clima di tempi lunghi passati. Durante i perforazioni nel progetto NEEM (North Greenland Eemian Ice Drilling), campioni di ghiaccio-core dal calotto centrale sono stati ottenuti in Groenlandia da profondità di oltre 2500 m. I livelli più alti della calotta glaciale del Groenlandia sono composti da cosiddetti firn snow, compressi in ghiaccio con una profondità crescente. Il grafico mostrato sotto mostra la densità nella parte superiore del ghiaccio della Groenlandia come funzione della profondità sotto la superficie.
Considerate un campione del nucleo di ghiaccio che ha circa la forma di un cilindro con diametro e altezza . La massa del campione è .
**1.a) ** Calcolare la densità approssimativa del campione e determinare da quale profondità del ghiaccio esso si origina.
In realtà, il campione non è perfettamente cilindrico, il che introduce errori nella determinazione della densità. Un metodo alternativo per determinare la densità evita questo problema.
Per questo, un bicchiere è riempito di acqua e posto su un equilibrio. Il campione viene poi inserito nel beaker in modo che galleggi in acqua. Finalmente, il campione è spinto sotto l’acqua con un oggetto puntato. Le masse indicate dal equilibrio in queste tre situazioni sono (beaker with water), (with the sample added), e (with the sample pushed down).
**1.b) ** Usando questo, determinare un valore più accurato per la densità del campione e la profondità del campionamento. Non fare alcuna ipotesi sulla forma del campione e utilizzare il valore per la densità di acqua.
Esaminando le impurità chimiche e i rapporti isotopici, si può determinare lo spessore dei livelli di ghiaccio depositati annualmente nel nucleo glaciale. Sotto pressione, il ghiaccio mostra proprietà di un fluido. Quindi il ghiaccio della copertura glaciale della Groenlandia non solo si comprime ma si muove dalla piattaforma glaciale verso le coste. Ciò provoca che gli strati di ghiaccio depositati annualmente diventino più sottili con una profondità crescente. La tabella seguente dà lo spessore dei livelli di ghiaccio in metri per anno per il nucleo NEEM:
| Depth in m | Thickness per year in m a |
|---|---|
| 0 | 0.25 |
| 500 | 0.20 |
| 1000 | 0.13 |
| 1200 | 0.10 |
| 1400 | 0.037 |
| 1500 | 0.018 |
| 1600 | 0.010 |
1.c) Using the data from the table, construct a graph that approximately shows the age of an ice sample as a function of the depth of the sampling.
**1.d) ** Using this, determine the age and of two ice-core samples taken at depths of and .
L’esame dei campioni consente di trarre conclusioni sui cambiamenti climatici. Un indicatore importante per questo è la quantità , che confronta il rapporto degli isotopi di ossigeno stabile a nel ghiaccio con un valore di riferimento. Studi sul livello di ghiaccio della Groenlandia mostrano che c’è una relazione lineare approssimativa tra questa quantità e la temperatura sopra il livello di ghiaccio. Per i due campioni esaminati, i valori sono e .
1.e) Determine approximately the temperatures and that prevailed above the ice layer at the time the two ice samples formed, and calculate the difference between the temperatures.
Density vs. depth in the NEEM ice core
Topic: Thermodynamics, Fluid Mechanics, Modern-Quantum Physics Metodi: Experimental Data Analysis, Hydrostatic Equilibrium, Graph Linearization Competenze: Experimental Data Analysis, Graph Linearization Objects: Cylinder, Container Fonte: Testo (PDF) — p.1
Problem 1 (10 points) — Ice-cold research
Samples from the depths of the Arctic and Antarctic ice sheets can provide insight into the climate of times long past. During the drilling in the NEEM project, ice-core samples from the central ice sheet were obtained in Greenland from depths of over 2500 m. The uppermost layers of the Greenland ice sheet consist of so-called firn snow, which is compressed into ice with increasing depth. The graph shown below depicts the density in the uppermost part of the Greenland ice sheet as a function of the depth below the surface.
Consider a sample from the ice core that has approximately the shape of a cylinder with diameter and height . The mass of the sample is .
**1.a) ** Calculate the approximate density of the sample and determine from which depth of the ice sheet it originates.
In reality, the sample is not perfectly cylindrical, which introduces errors in the density determination. An alternative method for determining the density avoids this problem.
For this, a beaker is filled with water and placed on a balance. The sample is then placed into the beaker so that it floats in the water. Finally, the sample is pushed underwater with a pointed object. The masses indicated by the balance in these three situations are (beaker with water), (with the sample added), and (with the sample pushed down).
1.b) Using this, determine a more accurate value for the density of the sample and the depth of the sampling. Make no assumption about the shape of the sample, and use the value for the density of water.
By examining chemical impurities and isotope ratios, the thickness of the annually deposited ice layers in the ice core can be determined. Under pressure, ice exhibits properties of a fluid. Therefore, the ice in the Greenland ice cover is not only compressed but also moves from the ice shelf towards the coasts. This causes the annually deposited ice layers to become thinner with increasing depth. The following table gives the thickness of the ice layers in metres per year for the NEEM core:
| Depth in m | Thickness per year in m a |
|---|---|
| 0 | 0.25 |
| 500 | 0.20 |
| 1000 | 0.13 |
| 1200 | 0.10 |
| 1400 | 0.037 |
| 1500 | 0.018 |
| 1600 | 0.010 |
1.c) Using the data from the table, construct a graph that approximately shows the age of an ice sample as a function of the depth of the sampling.
1.d) Using this, determine the age and of two ice-core samples taken at depths of and .
Examination of the samples allows conclusions to be drawn about climate change. An important indicator for this is the quantity , which compares the ratio of the stable oxygen isotopes to in the ice with a reference value. Studies of the Greenland ice layer show that there is an approximately linear relationship between this quantity and the temperature above the ice layer. For the two samples examined, the values are and .
**1.e) ** Determine approximately the temperatures and that prevailed above the ice layer at the time the two ice samples formed, and calculate the difference between the temperatures.
Density vs. depth in the NEEM ice core
Topic: Thermodynamics, Fluid Mechanics, Modern-Quantum Physics Metodi: Experimental Data Analysis, Hydrostatic Equilibrium, Graph Linearization Competenze: Experimental Data Analysis, Graph Linearization Objects: Cylinder, Container Fonte: Testo (PDF) — p.1