Problem — Aircraft take-off (accompanying graph)
This single-page document contains only the measurement graph for the “Aircraft take-off” problem of Round 1 of the selection competition for the IPhO 2027. The complete problem text is found in the main booklet (IPhO_2027_Aufgabenblatt_Rund1.pdf).
A smartphone was secured on board during an aircraft take-off and, using its accelerometer-sensor app, recorded the three spatial components of the acceleration as a function of time . The measurement data are available in the accompanying CSV file (IPhO_2027_flugzeugstart_accelerometer_data.csv) with the columns nr; time; ax; ay; az (all accelerations in , time in ).
The graph shows three data series over the time range to :
-
Vertical component (brown series, top): Initially fluctuates around (gravitational acceleration at rest). During the rotation at – it rises to (lift-off). In the climb it then drops to , which corresponds to the component of gravity reduced by the climb angle.
-
Longitudinal component (green series, middle): Stays near zero until (standstill). It then rises continuously to a plateau of (engine acceleration on the runway). It reaches a maximum of at – (rotation). In the climb it stabilises at .
-
Transverse component (blue series, bottom): Remains near zero throughout the entire measurement.
From the graph, the phases of the aircraft take-off (taxiing, accelerating, rotation, lift-off, climb) can be identified and physical quantities such as the runway acceleration, the take-off speed and the climb angle can be determined.
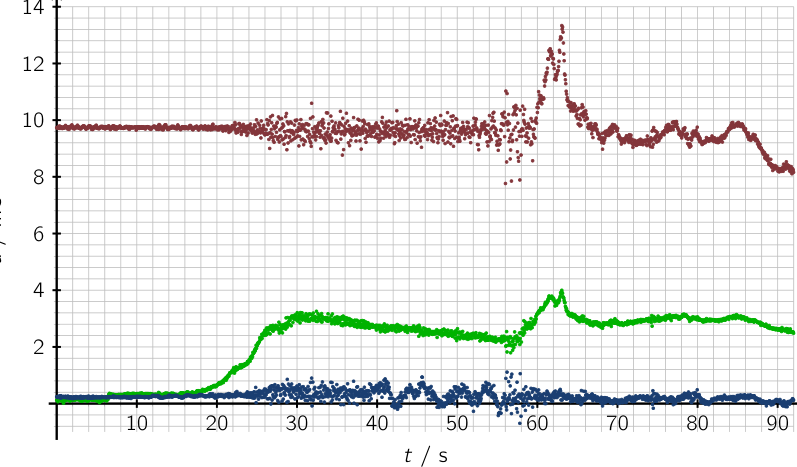 Acceleration components ax ay az during aircraft take-off
Topic: Newtonian Mechanics, Order-of-Magnitude Estimation Metodi: Kinematic Equations, Experimental Data Analysis, Free-Body Diagram Competenze: Experimental Data Analysis, Graph Linearization, Physical Reasoning Objects: — Fonte: Testo (PDF) — p.1
**Problema Aeroporto di partenza (grafico di accompagnamento) **
Questo documento di una pagina contiene solo il grafico di misurazione per il problema di “aeromobile di decollo” del primo round del concorso di selezione per l’IPhO 2027. Il testo completo del problema è trovato nel libro principale (IPhO_2027_taskblatt_Rund1.pdf).
Un smartphone è stato secured on board during an aircraft take-off and, using its accelerometer sensor app, recorded the three spatial components of the acceleration as a function of time . I dati di misurazione sono disponibili nel file CSV (IPhO_2027_aeroplanestart_accelerometer_data.csv) che accompagna le colonne nr; time; ax; ay; az (all accelerations in , time in ).
Il grafico mostra tre serie di dati nel tempo che vanno da a :
-
**Componente verticale (brown series, top): ** Initially fluctuates around (gravitational acceleration at rest). Durante la rotazione a t \approx 60$$63\,\mathrm{s} risce a (lift-off). In the climb it then drops to , che corrisponde al componente di gravità ridotto dall’angolo di salita.
-
Longitudinal component (green series, middle): Stays near zero until (standstill). Il motore si accelera continuamente fino a un plateau di (accelerazione del motore sulla pista). It reaches a maximum of at – (rotation). In the climb stabilisce a .
-
Componente trasversale (blue series, bottom): Remains near zero throughout the entire measurement.
Dal grafico, le fasi del decollo dell’aeromobile (taxiing, accelerating, rotation, lift-off, climb) possono essere identificate e quantitativi fisici come l’accelerazione della pista, la velocità di decollo e l’angolo di salita possono essere determinati.
Accelerazione dei componenti durante il decollo degli aerei
Topic: Newtonian Mechanics, Order-of-Magnitude Estimation Metodi: Kinematic Equations, Experimental Data Analysis, Free-Body Diagram Competenze: Experimental Data Analysis, Graph Linearization, Physical Reasoning Objects: — Fonte: Testo (PDF) — p.1
The following is the list of aircraft that have been involved in the flight:
This single-page document contains only the measurement graph for the “Aircraft take-off” problem of Round 1 of the selection competition for the IPhO 2027. The complete problem text is found in the main booklet (IPhO_2027_task sheet_Rund1.pdf).
A smartphone was secured on board during an aircraft take-off and, using its accelerometer sensor app, recorded the three spatial components of the acceleration as a function of time . The measurement data are available in the accompanying CSV file (IPhO_2027_aircraftstart_accelerometer_data.csv) with the columns nr; time; ax; ay; az (all accelerations in , time in ).
The graph shows three data series over the time range to :
-
**Vertical component (brown series, top): ** Initially fluctuates around (gravitational acceleration at rest). During the rotation at t \approx 60$$63\,\mathrm{s} it rises to (lift-off). In the climb it then drops to , which corresponds to the component of gravity reduced by the climb angle.
-
Longitudinal component (green series, middle): Stays near zero until (standstill). It then rises continuously to a plateau of (engine acceleration on the runway). It reaches a maximum of at t \approx 60$$63\,\mathrm{s} (rotation). In the climb it stabilizes at .
-
Transverse component (blue series, bottom): Remains near zero throughout the entire measurement.
From the graph, the phases of the aircraft takeoff (taxiing, accelerating, rotation, lift-off, climb) can be identified and physical quantities such as the runway acceleration, the takeoff speed and the climb angle can be determined.
Acceleration components during aircraft take-off
Topic: Newtonian Mechanics, Order-of-Magnitude Estimation Metodi: Kinematic Equations, Experimental Data Analysis, Free-Body Diagram Competenze: Experimental Data Analysis, Graph Linearization, Physical Reasoning Objects: — Fonte: Testo (PDF) — p.1