PARTE 1: DETERMINAZIONE DI g USANDO UN LIQUIDO IN ROTAZIONE [7.5 pt]
Quando un contenitore cilindrico riempito con liquido ruota intorno all’asse verticale passante per il suo centro, con velocità angolare costante , la superficie del liquido diventa parabolica. All’equilibrio, la tangente alla superficie nel punto forma un angolo con l’orizzontale, tale che
dove è il raggio del contenitore e è l’accelerazione di gravità.
Si può dimostrare che, per (dove è la velocità alla quale il centro del liquido raggiunge il fondo),
per si ha che (2)
cioè l’altezza del liquido è la stessa come se il liquido non rotasse.
Il profilo del liquido rotante è una parabola descritta dall’equazione:
dove il vertice è in e il fuoco è in .
- Dimostra l’Equazione (1).
- Misura l’altezza del liquido nel contenitore e il diametro interno di quest’ultimo.
- Interponi lo schermo tra la sorgente di luce e il contenitore. Misura la distanza fra lo schermo e la piattaforma rotante (vedi fig. 2).
- Allinea il laser in modo che il raggio punti verticalmente verso il basso e colpisca la superficie del liquido a una distanza dal centro del contenitore.
- Metti in rotazione lenta la piattaforma. Assicurati che il centro del liquido rotante non tocchi il fondo del contenitore.
- È noto che, ad una distanza , l’altezza del liquido rimane allo stesso valore originario , indipendentemente dalla velocità angolare . Facendo uso di questo fatto e misurando l’angolo della superficie per diversi valori di , esegui un esperimento per determinare l’accelerazione gravitazionale .
- Rappresenta in tabella le quantità misurate e quelle calcolate, per ciascun valore di .
- Traccia il grafico necessario per calcolare .
- Calcola il valore di e il relativo errore sperimentale.
- Riporta i valori , , , , il valore sperimentale di e il suo errore sul foglio risposte.
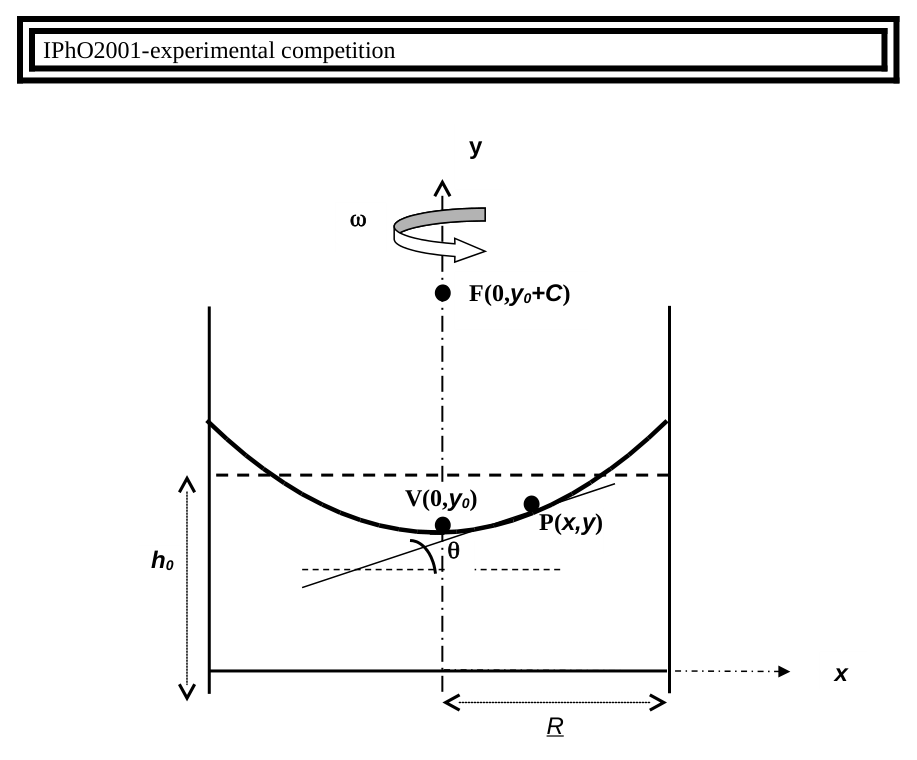 Parabolic surface rotating liquid geometry
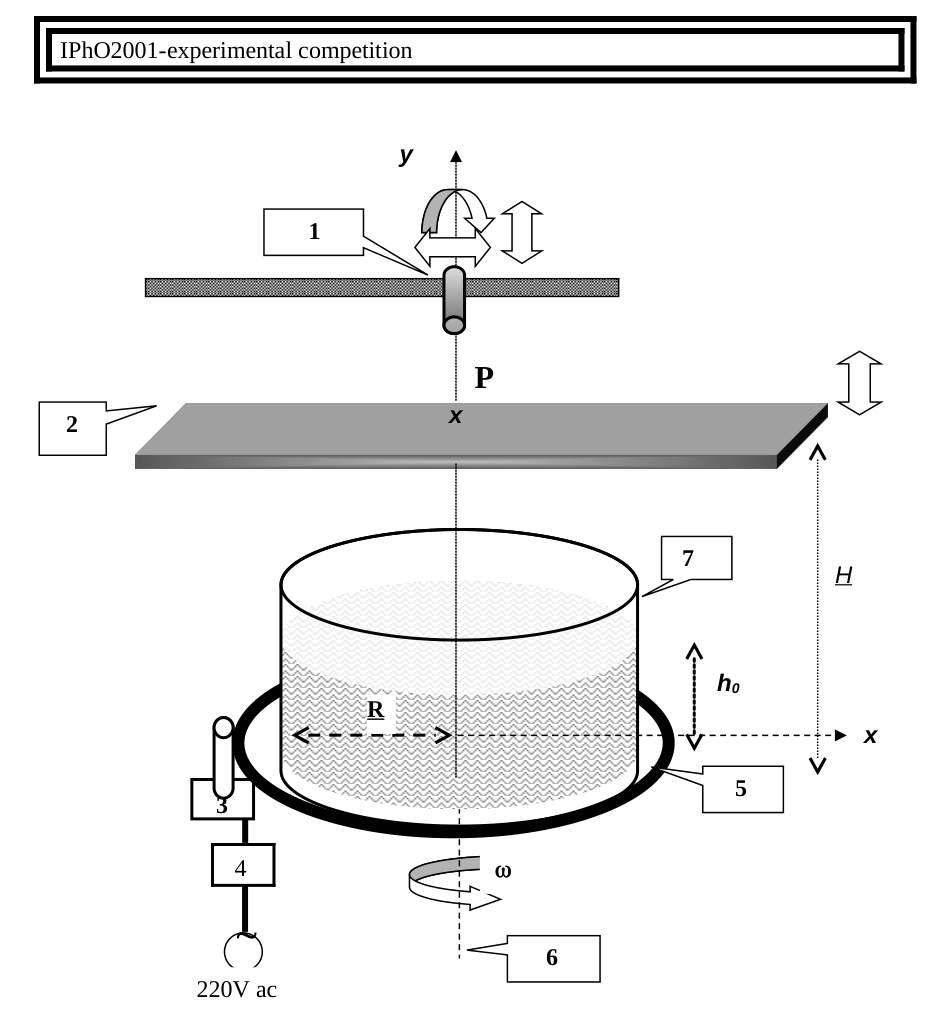 Experimental setup parts 1 and 2
Topic: Fluid Mechanics, Gravitation, Geometric Optics Metodi: Free-Body Diagram, Graph Linearization, Error Propagation Competenze: Experimental Data Analysis, Graph Linearization Objects: Container, Cylinder, Screen Fonte: Testo (PDF) — p.4
Part 1: Determination of g using a rotating liquid [7.5 p.t]
When a cylindrical container filled with liquid rotates around the vertical axis passing through its center, with a constant angular velocity , the surface of the liquid becomes parabolic. At equilibrium, the tangent to the surface at the point forms an angle with the horizontal, such that
where is the container radius and is the acceleration of gravity.
It can be shown that, for (where is the speed at which the center of the liquid reaches the bottom),
for we have that (2)
That is, the height of the liquid is the same as if the liquid were not rotating.
The profile of the rotating liquid is a parabola described by the equation:
where the summit is in and the fire is in .
- Show the equation (1).
- Measure the height of the liquid in the container and the internal diameter of the container.
- Put the screen between the light source and the container. Measure the distance between the screen and the rotating platform (see Fig. 2).
- align the laser so that the beam points vertically downwards and hits the surface of the liquid at a distance from the center of the container.
- Slowly rotate the platform. Make sure the center of the rotating liquid does not touch the bottom of the container.
- It is known that at a distance the height of the liquid remains at the same original value , regardless of the angular velocity . Using this fact and measuring the angle of the surface for different values of , run an experiment to determine gravitational acceleration .
- It shows in the table the quantities measured and calculated for each value of .
- Draw the graph needed to calculate .
- Calculate the value of and the corresponding experimental error.
- Returns the values , , , , the experimental value of and its error on the reply sheet.
The following table shows the parameters of the measurement of the measurement of the measurement of the measurement of the measurement of the measurement of the measurement of the measurement of the measurement of the measurement of the measurement of the measurement of the measurement of the measurement of the measurement of the measurement of the measurement of the measurement of the measurement of the measurement of the measurement of the measurement of the measurement of the measurement of the measurement of the measurement of the measurement.
The following information is provided by the Commission:
Topic: Fluid Mechanics, Gravitation, Geometric Optics Metodi: Free-Body Diagram, Graph Linearization, Error Propagation Competenze: Experimental Data Analysis, Graph Linearization Objects: Container, Cylinder, Screen Fonte: Testo (PDF) — p.4
PARTE 2a: DETERMINAZIONE DELLA DISTANZA FOCALE [5.5 pt]
Poiché la curvatura della superficie liquida varia con la velocità angolare , la distanza focale di questo sistema ottico dipende da . I raggi luminosi paralleli all’asse ottico riflessi dalla superficie parabolica sono focalizzati nel punto (vedi fig. 1).
- Allinea il laser in modo che il raggio sia diretto verticalmente, verso il basso, nel centro del contenitore. Contrassegna il punto in cui il raggio colpisce lo schermo: la retta che passa per questo punto e per il centro del contenitore è perciò l’asse ottico di questo sistema (vedi fig. 2).
- Poiché la superficie del liquido si comporta come uno specchio parabolico, ogni raggio incidente parallelo all’asse ottico passerà, dopo la riflessione, attraverso il fuoco sull’asse ottico.
- Regola la velocità di rotazione, in modo che il fuoco si trovi sullo schermo. Misura la velocità angolare e la distanza tra lo schermo e il piatto rotante.
- Ripeti i passi precedenti per valori differenti di .
- Riporta i valori misurati per e e il valore di per ciascun valore di sul foglio risposte.
- Con l’aiuto di un grafico appropriato che utilizzi i tuoi dati, trova la relazione fra la lunghezza focale e la velocità angolare . Riporta i tuoi dati sul foglio risposte.
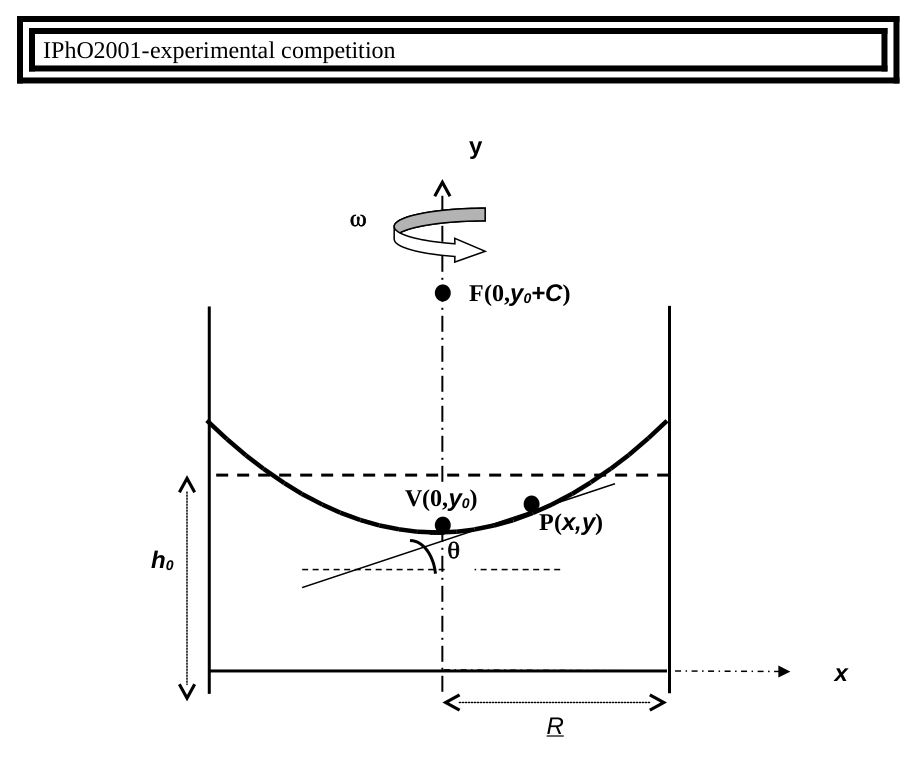 Parabolic surface rotating liquid geometry
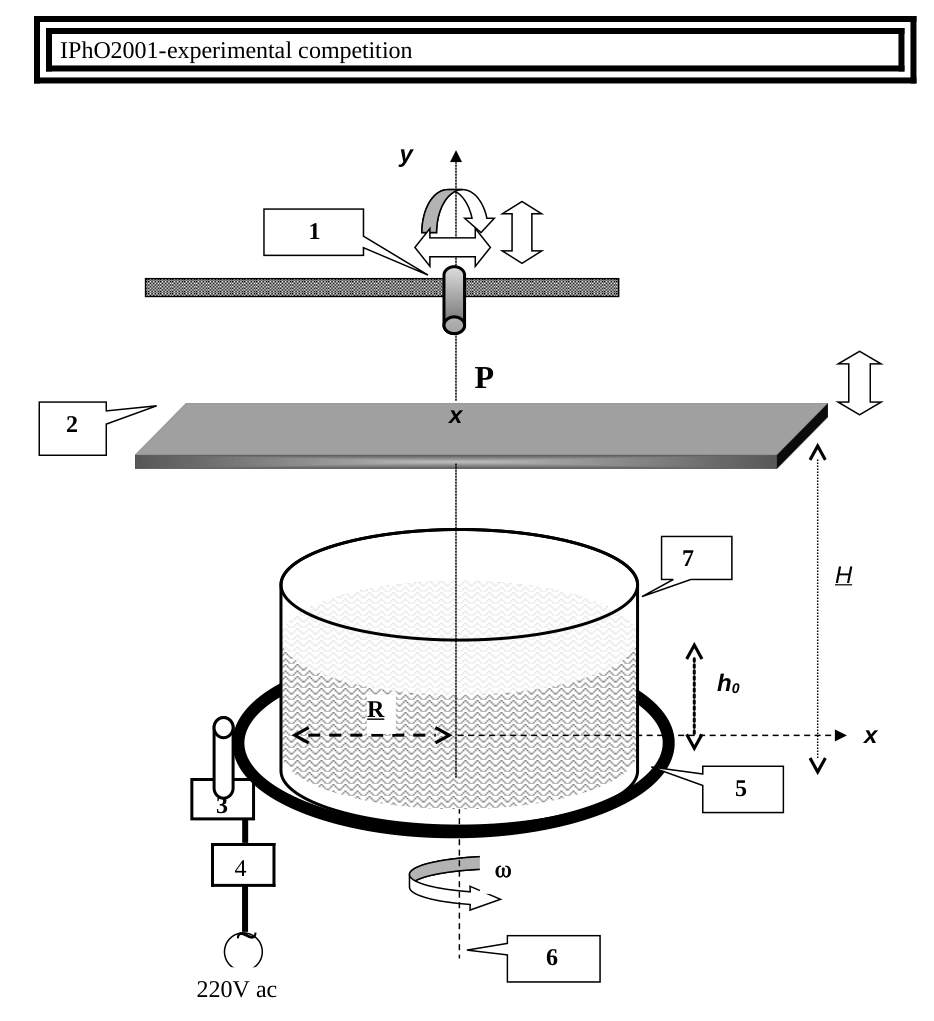 Experimental setup parts 1 and 2
Topic: Geometric Optics, Fluid Mechanics, Oscillations & Waves Metodi: Ray Tracing, Graph Linearization, Experimental Data Analysis Competenze: Experimental Data Analysis, Graph Linearization Objects: Mirror, Container, Screen Fonte: Testo (PDF) — p.5
The following information is provided by the Commission:
Since the curvature of the liquid surface varies with the angular velocity , the focal length of this optical system depends on . The parallel optical axis light rays reflected from the parabolic surface shall be focused at (see Fig. 1).
- Line the laser so that the beam is directed vertically downwards in the center of the container. It is contrasted with the point where the beam hits the screen: the straight line passing through this point and through the center of the container is therefore the optical axis of this system (see Fig. 2).
- Since the surface of the liquid behaves like a parabolic mirror, any incident ray parallel to the optical axis will pass through the light on the optical axis after reflection.
- Adjust the rotation speed so the fire is on the screen. Measure the angular speed and the distance between the screen and the rotating plate.
- Repeat the previous steps for different values of .
- Returns the measured values for and and the value of for each value of on the reply sheet.
- Using an appropriate graph using your data, find the relationship between focal length and angular velocity . Put your data back on the answer sheet.
The following table shows the parameters of the measurement of the measurement of the measurement of the measurement of the measurement of the measurement of the measurement of the measurement of the measurement of the measurement of the measurement of the measurement of the measurement of the measurement of the measurement of the measurement of the measurement of the measurement of the measurement of the measurement of the measurement of the measurement of the measurement of the measurement of the measurement of the measurement of the measurement.
The following information is provided by the Commission:
Topic: Geometric Optics, Fluid Mechanics, Oscillations & Waves Metodi: Ray Tracing, Graph Linearization, Experimental Data Analysis Competenze: Experimental Data Analysis, Graph Linearization Objects: Mirror, Container, Screen Fonte: Testo (PDF) — p.5
PARTE 2b: ANALISI DELL‘“IMMAGINE” [3.5 pt]
In questa parte dell’esperimento, verranno analizzate le proprietà dell‘“immagine” prodotta da questo sistema ottico (superficie liquida parabolica come specchio).
- Rimuovi la testina del laser ruotandola in senso antiorario.
- Monta la nuova testina (fornita in una busta) girandola in senso orario: ora il laser produce un fascio divergente di forma ben definita, al posto di un raggio stretto.
- Regola la posizione del laser in modo che il fascio, quasi verticale, sia diretto verso il centro del fondo del recipiente.
- Sullo schermo orizzontale, che devi disporre subito sopra al contenitore, poni un foglio di carta semitrasparente in modo che il fascio di luce non colpisca la carta che però deve essere colpita dal fascio riflesso.
- Osserva le dimensioni e l’orientamento dell‘“immagine” prodotta sia dal fascio uscente dal laser che da quello riflesso dal liquido quando non ruota.
- Metti in rotazione il liquido e aumenta gradualmente la velocità angolare , fino al massimo ottenibile, mentre osservi lo schermo. Mentre cresce, puoi osservare intervalli di frequenza diversi nei quali le proprietà dell‘“immagine” sono nettamente diverse. Per descrivere queste osservazioni completa la tabella nel foglio risposte aggiungendo una riga alla tabella per ogni intervallo di frequenza, e riempila usando le notazioni specificate:
- Orientazione: INV (invertita) o ER (diritta)
- Variazione delle dimensioni all’aumentare di : I (aumento), D (diminuzione), NC (nessun cambiamento)
- “R” se lo schermo è più in alto del fuoco; “V” se lo schermo è più in basso del fuoco.
Topic: Geometric Optics, Fluid Mechanics Metodi: Ray Tracing, Physical Modeling Competenze: Physical Reasoning, Experimental Data Analysis Objects: Mirror, Container, Screen Fonte: Testo (PDF) — p.5
The following information is provided by the Commission in the field of information and communication technology:
In this part of the experiment, the properties of the “image” produced by this optical system (a liquid parabolic surface such as a mirror) will be analysed.
Remove the laser head by rotating it off-clock.
- Mount the new head (provided in a bag) and turn it clockwise: the laser now produces a divergent beam of a well-defined shape, instead of a narrow beam. Adjust the position of the laser so that the beam, almost vertical, is directed towards the center of the bottom of the container.
- On the horizontal screen, which you must place immediately above the container, place a sheet of paper that is semitranseparate so that the beam of light does not hit the paper which must be hit by the reflected beam.
- Observe the size and orientation of the “image” produced by both the beam coming out of the laser and the beam reflected from the liquid when it is not rotating.
- Turn the liquid and gradually increase the angular velocity to the maximum possible while you are looking at the screen. As grows, you can observe different frequency ranges in which the “image” properties are markedly different. To describe these observations, complete the table in the answer sheet by adding a line to the table for each frequency range, and fill in using the specified notations:
- Direction: INV or ER
- Change in size by increasing : I (increase), D (decrease), NC (no change)
- “R” if the screen is higher than the fire; “V” if the screen is lower than the fire.
Topic: Geometric Optics, Fluid Mechanics Metodi: Ray Tracing, Physical Modeling Competenze: Physical Reasoning, Experimental Data Analysis Objects: Mirror, Container, Screen Fonte: Testo (PDF) — p.5
PARTE 3: INDICE DI RIFRAZIONE [3.5 pt]
In questa parte dell’esperimento, verrà determinato l’indice di rifrazione del liquido dato, usando un reticolo di diffrazione. Quando una radiazione di lunghezza d’onda incide perpendicolarmente su un reticolo, i massimi della figura di diffrazione vengono osservati ad angoli dati dalla relazione
dove è l’ordine di diffrazione e è la distanza tra le fenditure del reticolo. In questa parte dell’esperimento verrà usato un reticolo di diffrazione sia per determinare la lunghezza d’onda del laser che per determinare l’indice di rifrazione del liquido (vedi fig. 3).
- Usa il reticolo per determinare la lunghezza d’onda del laser. Riporta il risultato sul foglio risposte.
- Immergi il reticolo, disponendolo verticalmente, al centro del contenitore.
- Allinea il raggio laser in modo che entri nel liquido attraverso una parete del contenitore e colpisca perpendicolarmente il reticolo.
- Osserva la figura di diffrazione prodotta su una scala millimetrata applicata sulla parete opposta del contenitore.
- Esegui ogni misura di lunghezza che sia necessaria.
- Calcola l’indice di rifrazione del liquido usando le tue misure. (Ignora l’effetto del recipiente sul cammino della luce).
- Riporta il risultato del tuo esperimento sul foglio risposte.
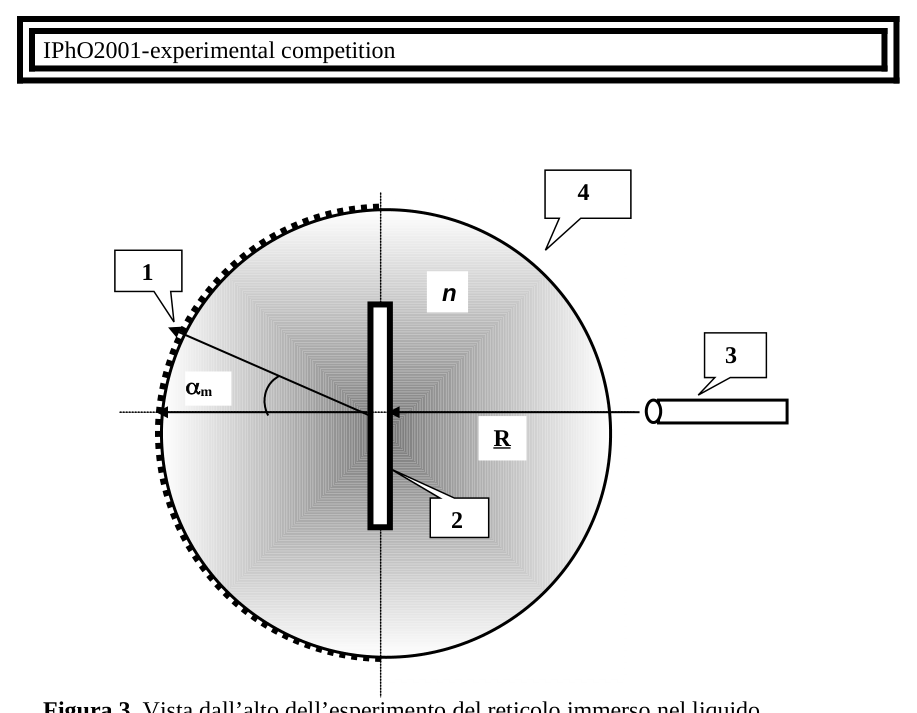 Top view diffraction grating in liquid
Topic: Wave Optics, Geometric Optics Metodi: Interference & Diffraction Analysis, Snell’s Law, Experimental Data Analysis Competenze: Experimental Data Analysis, Physical Reasoning Objects: Diffraction Grating, Container, Screen Fonte: Testo (PDF) — p.6
PARTE 3: INDICE DI RIFRAZIONE [3.5 pt]
In this part of the experiment, the refractive index of the given liquid will be determined using a diffraction lattice. When a wavelength radiation is perpendicular to a lattice, the maximum diffraction figures are observed at angles given by the report
where is the order of diffraction and is the distance between the cracks of the reticulum. In this part of the experiment a diffraction lattice will be used both to determine the laser wavelength and to determine the index of refraction of the liquid (see Fig. 3).
- Use the lattice to determine the laser wavelength . Report the result on the reply sheet.
- Immerse the mesh, placing it vertically in the centre of the container.
- aligns the laser beam so that it enters the liquid through a wall of the container and hits the mesh perpendicularly.
- Observe the diffraction figure produced on a millimeter scale applied to the opposite wall of the container.
- Take any length measurements you need.
- Calcola l’indice di rifrazione del liquido usando le tue misure. (Ignore the effect of the container on the path of light).
- Report the result of your experiment on the answer sheet.
Top view diffraction grating in liquid
Topic: Wave Optics, Geometric Optics Metodi: Interference & Diffraction Analysis, Snell’s Law, Experimental Data Analysis Competenze: Experimental Data Analysis, Physical Reasoning Objects: Diffraction Grating, Container, Screen Fonte: Testo (PDF) — p.6