Фурье-спектрометр¹
Экспериментальный тур — 3 февраля 2023 года (XIX IZhO). Экспериментальный тур состоит из одной задачи. Продолжительность тура 4 часа.
Введение
Основной элемент Фурье спектрометра – интерферометр Майкельсона.
Допустим, у нас имеется когерентный источник излучения с определенной длиной волны. Когда разность хода двух лучей, пришедших в приемник, кратна половине длине волны, то есть лучи пришли в противофазе, интенсивность регистрируемого излучения близка к нулю. При перемещении одного из зеркал интерферометра разность хода лучей изменяется, поэтому изменяется и интенсивность света, регистрируемая приемником. Известно, что интенсивность будет максимальная, когда разность хода кратна длине волны.
Если одно из зеркал интерферометра движется с постоянной скоростью, тогда на выходе приемника будет наблюдаться синусоидальный сигнал. Амплитуда синусоиды пропорциональна интенсивности света, а ее период зависит от длины волны.
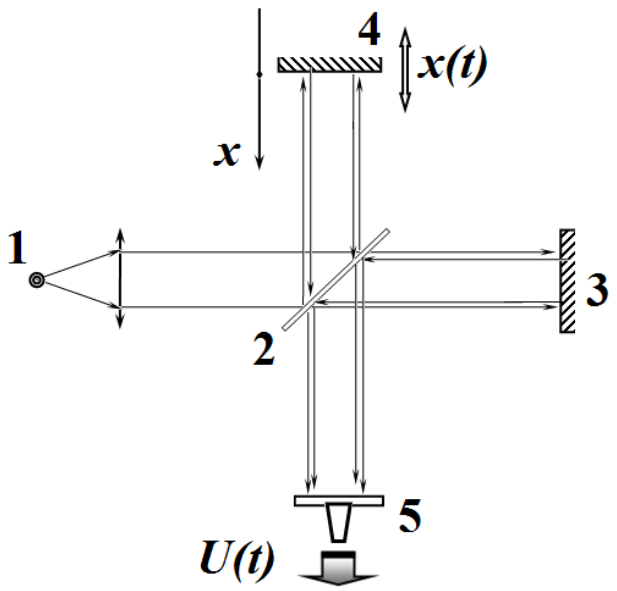
На рисунке показана схема интерферометра Майкельсона. Световой поток от источника 1 с помощью линз формируется в параллельный пучок лучей и направляется на светоделительную пластинку 2. Часть света (половина по интенсивности) проходит через пластинку, попадает на неподвижное зеркало 3, полностью отражается от него и снова попадает на пластинку 2, отражается от нее и попадает на экран с фотоприемником 5. Вторая половина светового потока от источника отражается от светоделительной пластинки 2 и попадает на подвижное зеркало 4, отражается от него, проходит через пластинку 2 и также попадает на экран с фотоприемником 5. Таким образом, на экран попадают две когерентные волны, отраженные от зеркал 3 и 4. Эти волны интерферируют между собой, а приемник регистрирует результирующую интенсивность света на экране, как функцию времени. Эта функция записывается в память компьютера для последующей обработки.
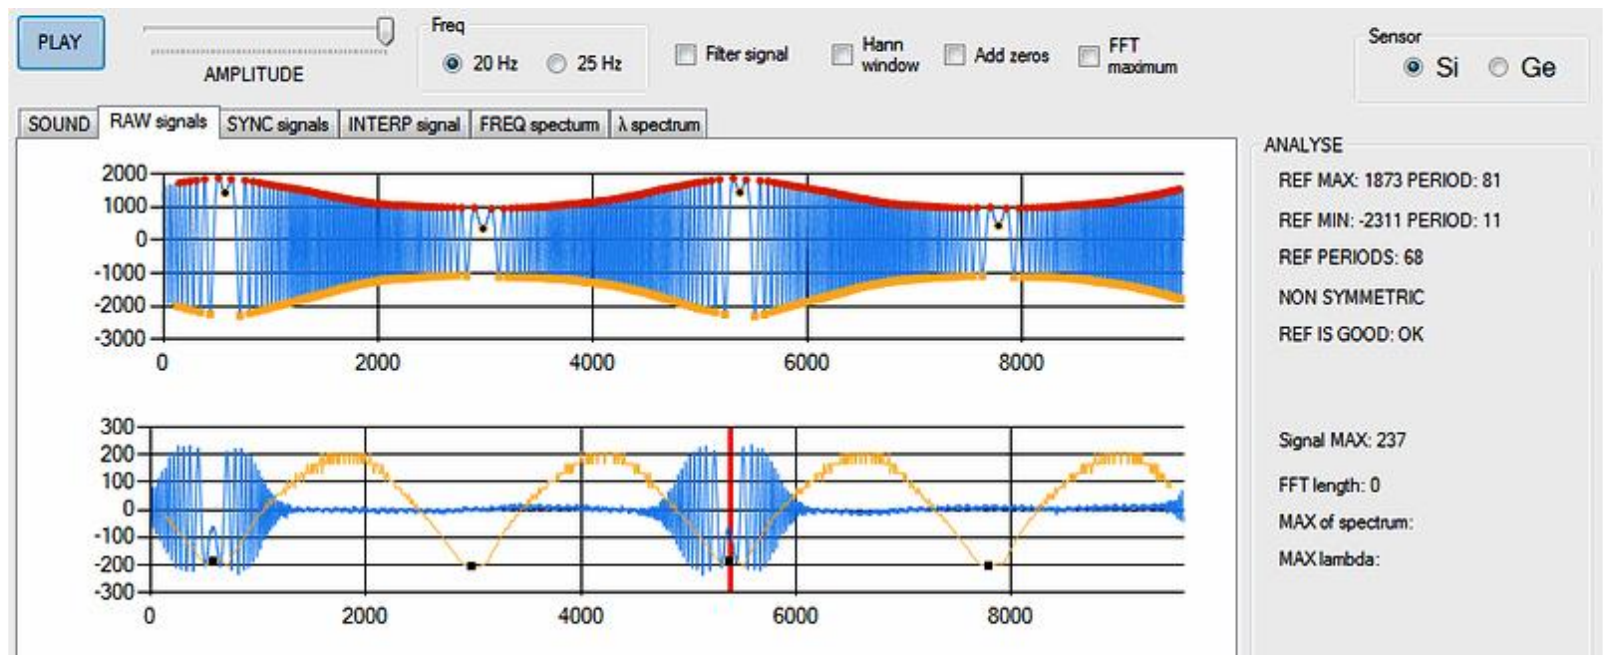
Для иллюстрации приводим фотографию зарегистрированного сигнала из указанной статьи.
Теперь представим, что зеркало 4 движется неравномерно и/или источник света не является монохроматическим, то есть содержит в себе несколько длин волн. Таким образом, на выходе будем иметь более сложный чем синусоидальный сигнал. При соответствующей математической обработке этого сигнала можно получить закон движения зеркала 4 или спектр излучения источника света, то есть интенсивность излучения на различных длинах волн.
При выполнении заданий используйте упрощающие положения и обозначения:
- регистрируемое фотоприемником напряжение пропорционально интенсивности света, чувствительность фотоприемника не зависит от длины волны света; с помощью электронной схемы постоянная составляющая сигнала отрезается, поэтому на графиках отражается только переменная составляющая;
- подвижное зеркало колеблется по гармоническому закону с частотой 20 Гц и постоянной амплитудой; можно считать, что при разность хода интерферирующих волн равна нулю;
- интенсивности интерферирующих на приемнике волн равны;
- начало регистрации сигнала согласовано с движением подвижного зеркала и всегда начинается при одном и том же положении зеркала;
- регистрация сигнала проводится в равноотстоящие моменты времени и записывается в ячейки памяти, которые в дальнейшем нумеруются целыми значениями . Фактически есть время регистрации в относительных единицах.
- на всех рисунках приводятся графики зависимостей регистрируемого напряжения от номера ячейки памяти . Для упрощения работы к каждому графику прилагается таблица, в которой указаны положения экстремумов (максимумов и минимумов) зарегистрированного сигнала , эти экстремумы нумеруются буквой .
Внимание! На отдельных листах Writing sheets приведены зарегистрированные сигналы зависимости напряжения на фотоприемнике от времени, которые вам предстоит обрабатывать. Отметим, что приведены только часть всех сигналов. При выполнении данного задания Вам нет необходимости использовать все приведенные численные данные. Используйте только те, которые считаете необходимыми для расчета требуемых величин. При построении графиков используйте разумное количество данных (10-15 точек), однако помните, что точность расчетов повышается при увеличении числа используемых данных. Обязательно указывайте в решении, какие данные Вы используете, также обязательно приводите формулы, по которым проводятся расчеты. Для проведения расчетов Вы должны использовать подготовленные таблицы в Writing sheets. Для построения графиков используйте бланки, приведенные в тех же Writing sheets. Обратите внимание, что только Writing sheets будут оцениваться. Для черновых записей вы можете использовать белые листы бумаги, но они оцениваться не будут!
Задания
1. Теоретическая часть
Интерферометр освещается монохроматическим излучением с длиной волны .
1.1 Обозначим интенсивность каждой из интерферирующих волн , сдвиг фаз между волнами . Запишите формулу для интенсивности результирующей волны.
1.2 Запишите формулу для интенсивности волны на приемнике в зависимости от положения подвижного зеркала .
1.3 Запишите формулы, указывающие, при каких значениях координаты зеркала интенсивность света на экране будет максимальна, а при каких минимальна.
1.4 Запишите общую формулу, определяющую координату зеркала , при которой интенсивность света на экране экстремальна.
2. Монохроматическое излучение известной длины волны – градуировка прибора
На рисунке 1 показана зависимость интенсивности света от времени при освещении интерферометра монохроматическим излучением с длиной волны мкм. В таблице 1 приведены значения времен , при которых интенсивность света экстремальна (максимумы и минимумы), а также значения сигнала в эти моменты времени.
2.1 Определите цену деления использованной временной шкалы данного устройства в миллисекундах.
В дальнейшем все расчеты проводите в условных единицах шкалы прибора.
2.2 На основе приведенных экспериментальных данных покажите, что движение зеркала может быть описано функцией
Определите значения параметров этой функции: период в единицах цены деления шкалы; амплитуду колебаний в микрометрах; момент времени , при котором . Постройте линеаризованный график зависимости (1), доказывающий применимость этой формулы для описания колебаний зеркала. Оцените погрешность определения амплитуды колебаний .
Функцию (1) с найденными значениями параметров следует использовать при выполнении следующих частей задания.
3. Монохроматическое излучение с неизвестной длиной волны
Интерферометр освещается монохроматическим излучением с неизвестной длиной волны, которую вам необходимо определить.
На рисунке 2 показана зависимость интенсивности света от времени в этом случае. В таблице 2 приведены значения координат экстремумов этой функции.
3.1 Постройте график зависимости координаты зеркала , при которых интенсивность экстремальная, от номера экстремума .
3.2 Используя построенный график, определите с максимальной точностью значение длины волны света источника. Оцените погрешность найденного значения.
4. Две монохроматические волны
Интерферометр освещается излучением, содержащим две монохроматические волны. Длина волны одной из них равна мкм, а длина волны второй неизвестна.
На рисунке 3 приведена зависимость интенсивности света на экране от времени. В таблице 3 приведены значения экстремумов приведенной функции.
4.1 Используя приведенные данные, определите с максимальной точностью длину волны второй спектральной компоненты. Оцените погрешность найденного значения длины волны .
4.2 Определите отношение интенсивностей второй и первой волн .
¹ Данное задание разработано на основе материалов статьи «Самодельный Фурье-спектрометр» (https://habr.com/ru/post/253947/).
Рисунки 1–3 и таблицы 1–3 даны на отдельных листах Writing sheets и в официальном PDF отсутствуют.
Topic: Wave Optics Metodi: Interference & Diffraction Analysis, Experimental Data Analysis, Graph Linearization Competenze: Experimental Data Analysis, Measurement & Instrumentation
Spettrometro di Fourier¹
Prova sperimentale — 3 febbraio 2023 (XIX IZhO). La durata della competizione sperimentale è di 4 ore. È previsto un solo problema.
Tradotto dalla versione ufficiale inglese stampata nello stesso PDF (pagine 5–8).
Introduzione
L’elemento principale dello spettrometro di Fourier è l’interferometro di Michelson.
Supponiamo di disporre di una sorgente luminosa coerente con una determinata lunghezza d’onda. Quando la differenza nel percorso dei due fasci luminosi che raggiungono il rivelatore è un multiplo della metà della lunghezza d’onda, cioè i fasci arrivano in antifase, l’intensità della luce rilevata è quasi zero. Quando uno degli specchi dell’interferometro viene spostato, la differenza nel percorso dei raggi luminosi cambia, e di conseguenza varia anche l’intensità della luce registrata dal rivelatore. È noto che l’intensità è massima quando la differenza nel percorso è un multiplo della lunghezza d’onda.
Se uno degli specchi dell’interferometro viene spostato a velocità costante, all’uscita del rivelatore si osserverà un segnale sinusoidale. L’ampiezza di questo segnale è proporzionale all’intensità della luce, mentre il suo periodo dipende dalla lunghezza d’onda.
La figura mostra la configurazione dell’interferometro di Michelson. Il flusso luminoso proveniente dalla sorgente 1 viene formato da lenti in un fascio di raggi paralleli e diretto verso il separatore di fasci 2. Una parte della luce (metà dell’intensità) attraversa la lamina per colpire lo specchio fermo 3, dove viene completamente riflessa; successivamente colpisce di nuovo la lamina 2, ne viene riflessa e raggiunge lo schermo con il fotorivelatore 5. L’altra metà del flusso luminoso viene invece riflessa dalla lamina divisoria 2 e colpisce lo specchio mobile 4; da qui viene nuovamente riflessa, attraversa la lamina 2 e raggiunge lo schermo con il fotorivelatore 5. Di conseguenza, due onde coerenti riflesse dagli specchi 3 e 4 giungono sullo schermo; queste onde interferiscono tra loro e il ricevitore registra l’intensità luminosa risultante in funzione del tempo. Questa informazione viene memorizzata nel computer per ulteriori elaborazioni.
A titolo illustrativo, presentiamo una fotografia del segnale registrato tratta dall’articolo citato.
Ora immaginiamo che lo specchio 4 si muova in modo non uniforme e/o che la sorgente di luce non sia monocromatica, cioè contenga diverse lunghezze d’onda. Di conseguenza, all’uscita verrà rilevato un segnale più complesso di uno sinusoidale. Attraverso un appropriato trattamento matematico del segnale, è possibile ottenere la legge di movimento dello specchio 4 o lo spettro luminoso della sorgente, ovvero l’intensità della luce alle diverse lunghezze d’onda.
Nella risoluzione dei problemi, si utilizzino le seguenti ipotesi semplificative e notazioni.
-
La tensione registrata dal fotorivelatore è proporzionale all’intensità della luce; la sensibilità del fotorivelatore non dipende dalla lunghezza d’onda della luce. Utilizzando un circuito elettronico, la componente costante del segnale viene eliminata, in modo che venga visualizzata solo la componente variabile sui grafici.
-
Lo specchio mobile oscilla secondo una legge armonica , con una frequenza di 20 Hz e un’ampiezza costante. Si assume che, quando , la differenza di cammino delle onde interferenti sia uguale a zero.
-
Le intensità delle onde interferenti al ricevitore sono uguali.
-
L’inizio della registrazione del segnale è sincronizzato con il moto dello specchio mobile e avviene sempre nella stessa posizione dello specchio.
-
La registrazione del segnale viene effettuata in momenti temporali equidistanti e i dati vengono memorizzati in celle di memoria, numerate con valori interi . Il tempo di registrazione viene indicato in unità relative.
-
Tutti i grafici presenti nel problema mostrano le relazioni tra la tensione registrata e il numero della cella di memoria. Per semplificare la soluzione, ogni grafico è accompagnato da una tabella che indica le posizioni degli estremi (massimi e minimi) del segnale registrato ; questi estremi vengono numerati con la lettera .
Attenzione! Su fogli separati (Writing sheets) sono riportati i segnali registrati, sotto forma della dipendenza della tensione del fotorivelatore dal tempo, che si dovranno elaborare. Si noti che è riportata solo una parte di tutti i segnali. Per risolvere questo problema non è necessario utilizzare tutti i dati numerici forniti: utilizzare solo quelli ritenuti necessari per calcolare le grandezze richieste. Nel tracciare i grafici utilizzare un numero ragionevole di dati (10-15 punti), ricordando però che l’accuratezza dei calcoli aumenta con il numero di dati utilizzati. Indicare sempre nella soluzione quali dati si utilizzano e riportare le formule usate per i calcoli. Per i calcoli occorre utilizzare le tabelle predisposte nei Writing sheets. Per tracciare i grafici, utilizzare i moduli riportati negli stessi Writing sheets. Si noti che saranno valutati solo i Writing sheets. Per la brutta copia si possono usare fogli bianchi, che però non saranno valutati!
Problemi
1. Parte teorica
L’interferometro viene illuminato da radiazione monocromatica la cui lunghezza d’onda è .
1. Indichiamo con l’intensità di ciascuna delle onde interferenti e con lo sfasamento tra le onde. Scrivere la formula per l’intensità dell’onda risultante.
1.2 Scrivere la formula per l’intensità dell’onda ricevuta in funzione della posizione dello specchio mobile .
1.3 Scrivere le formule che indicano i valori di della posizione dello specchio per cui l’intensità luminosa sullo schermo è massima o, rispettivamente, minima.
1.4 Scrivere la formula generale che determina il valore di dello specchio al quale l’intensità luminosa sullo schermo raggiunge i valori estremi.
2. Radiazione monocromatica di lunghezza d’onda nota come strumento di calibrazione
La Figura 1 mostra la dipendenza dell’intensità luminosa dal tempo quando l’interferometro viene illuminato con radiazione monocromatica di lunghezza d’onda . La Tabella 1 riporta i valori di nei quali l’intensità luminosa raggiunge i valori estremi (massimi e minimi), nonché i valori del segnale in quei momenti.
2.1 Determinare il valore della divisione dell’apparecchio, espresso in millisecondi.
In seguito, tutti i calcoli devono essere eseguiti esclusivamente nelle unità di misura dello strumento.
2.2 Sulla base dei dati sperimentali forniti, dimostrare che il movimento dello specchio può essere descritto dalla funzione:
Determinare i valori dei parametri di questa funzione: periodo espresso in unità della scala dello strumento; ampiezza delle oscillazioni espressa in micrometri; istante di tempo in cui . Tracciare un grafico linearizzato della dipendenza (1), dimostrando l’applicabilità della formula sopra indicata per descrivere le oscillazioni dello specchio. Stimare l’errore nella determinazione dell’ampiezza delle oscillazioni.
La funzione (1), una volta calcolati i parametri corretti, dovrà essere utilizzata nelle seguenti parti del problema.
3. Radiazione monocromatica di lunghezza d’onda sconosciuta
L’interferometro viene illuminato da una radiazione monocromatica la cui lunghezza d’onda è sconosciuta e deve essere determinata.
La Figura 2 mostra la dipendenza dell’intensità luminosa dal tempo in questo caso. La Tabella 2 riporta i valori delle coordinate degli estremi per questa specifica situazione.
3.1 Tracciare il grafico che rappresenti la dipendenza delle coordinate dello specchio , nei punti in cui l’intensità luminosa raggiunge i valori massimi o minimi, in funzione del numero dell’estremo .
3.2 Utilizzando il grafico tracciato, determinare con la massima precisione possibile la lunghezza d’onda della sorgente luminosa. Stimare l’errore del valore ottenuto.
4. Due onde monocromatiche
L’interferometro viene illuminato da una radiazione che contiene due onde monocromatiche. La lunghezza d’onda di una di queste è , mentre la lunghezza d’onda della seconda è sconosciuta.
La Figura 3 mostra la dipendenza dell’intensità luminosa sullo schermo in funzione del tempo. La Tabella 3 riporta i valori degli estremi per questo caso particolare.
4.1 Utilizzando i dati forniti, determinare con la massima accuratezza la lunghezza d’onda della seconda componente spettrale. Stimare l’errore del valore trovato per la lunghezza d’onda.
4.2 Determinare il rapporto tra le intensità della seconda e della prima onda, .
¹ Questo problema si basa sull’articolo “Spettrometro di Fourier fai da te” (https://habr.com/ru/post/253947/).
Le Figure 1–3 e le Tabelle 1–3 sono state fornite su fogli separati e non sono incluse nel PDF ufficiale.
Fourier spectrometer¹
Experimental competition — February 3, 2023 (XIX IZhO). The duration of the experimental competition is 4 hours. There is one problem.
Text: official English version printed in the same PDF (pages 5–8).
Introduction
The main element of the Fourier spectrometer is the Michelson interferometer.
Assume that we have a coherent light source with a certain wavelength. When the difference in the path of the two beams that come to a receiver is a multiple of half the wavelength, that is, the beams come in antiphase, the intensity of the detected intensity is close to zero. When one of the mirrors of the interferometer is moved, the difference in the path of the light rays changes, so the light intensity recorded by the receiver also varies. It is known that the intensity is to be maximum when the path difference is a multiple of the wavelength.
If one of the mirrors of the interferometer moves at a constant speed, then a sinusoidal signal is to be observed at the output of the receiver. The amplitude of the sinusoid is proportional to the light intensity, and its period depends on the wavelength.
The figure shows a setup of the Michelson interferometer. The light flux from source 1 is formed by lenses into a parallel beam of rays and directed to beam splitter 2. Part of the light (half in intensity) passes through the plate to hit the fixed mirror 3 and is completely reflected from it, and then hits the plate 2 again to be reflected from it and hit the screen with the photodetector 5. The second half of the light flux from the source is reflected from the beam-splitting plate 2 to hit the movable mirror 4, it is then reflected to pass through the plate 2 and hit the screen with the photodetector 5. Thus, two coherent waves reflected from the mirrors 3 and 4 fall on the screen. These waves interfere with each other, and the receiver registers the resulting light intensity on the screen as a function of time. This function is written to the computer’s memory for further processing.
For illustration, we present a photograph of the registered signal from the specified article.
Let us now imagine that the mirror 4 moves non-uniformly and/or the light source is not monochromatic, i.e. it contains several wavelengths. Thus. at the output a more complex than a sinusoidal signal is to be detected. With appropriate mathematical signal processing, it is possible to obtain the motion law of the mirror 4 or the light spectrum of the source, that is, the light intensity at different wavelengths.
When solving problems, use the following simplifying assumptions and notation:
- the voltage recorded by the photodetector is proportional to the light intensity, the sensitivity of the photodetector does not depend on the light wavelength; using an electronic circuit, the constant component of the signal is cut off, so only the variable component is reflected on the graphs;
- the movable mirror oscillates according to a harmonic law with a frequency of 20 Hz and a constant amplitude; it is assumed that at , the path difference of the interfering waves is equal to zero;
- the intensities of the interfering waves at the receiver are equal;
- the beginning of the signal registration is coordinated with the motion of the movable mirror and always starts at the same position of the mirror;
- signal registration is carried out at equidistant moments of time and recorded in memory cells, which are further numbered with integer values . In fact, the registration time is recorded in relative units.
- all the figures in the problem show graphs of the dependences of the recorded voltage on the number of the memory cell. To simplify the solution, each graph is accompanied by a table, which indicates the positions of the extrema (maxima and minima) of the registered signal , the extrema themselves are numbered with the letter .
Attention! On separate Writing sheets, the registered signals are given in the form of the dependence of the photodetector voltage on the time, which you are assumed to process. Note that only a part of all signals are given. When solving this problem, you do not need to use all the given numerical data. Use only those that you consider necessary to calculate the required values. When plotting, use a reasonable amount of data (10-15 points), but remember that the accuracy of the calculations increases when the number of data used grows. Be sure to indicate in the solution, which data you use, and be sure to include the formulas used for calculations. For calculations, you must use the prepared tables in the Writing sheets. To draw graphs, use the forms given in the same Writing sheets. Please note that only Writing sheets are to be graded. For draft notes, you can use white sheets of paper, but they will not be graded!
Problems
1. Theoretical part
The interferometer is illuminated by the monochromatic radiation with the wavelength .
1. Let us denote as the intensity of each of the interfering waves, and the phase shift between the waves as . Write down the formula for the intensity of the resulting wave.
1.2 Write down the formula for the intensity of the wave at the receiver as a function of the position of the movable mirror .
1.3 Write down formulas indicating at what values of the mirror position the light intensity on the screen is to be maximum or, correspondingly, minimum.
1.4 Write down the general formula that determines the mirror coordinate , at which the light intensity on the screen is extreme.
2. Monochromatic radiation of a known wavelength as an instrument calibration
Figure 1 shows the dependence of the light intensity on the time when the interferometer is illuminated with monochromatic radiation with the wavelength . Table 1 shows the times at which the light intensity is extreme (maxima and minima), as well as the signal values at corresponding time moments.
2.1 Determine the division value of the device in milliseconds.
In the following, all calculations must only be carried out in the units of the instrument scale.
2.2 On the basis of the given experimental data, show that the motion of the mirror can be described by the function
Find the values of the parameters of this function: period in units of the instrument scale; oscillation amplitude in micrometers; point in time at which . Plot a linearized graph of dependence (1), proving the applicability of the above formula to describe the oscillations of the mirror. Estimate the error in determining the amplitude of oscillations.
Function (1) with the found values of the parameters should be used when performing the following parts of the problem.
3. Monochromatic radiation with unknown wavelength
The interferometer is illuminated by a monochromatic radiation with an unknown wavelength that you have to determine.
Figure 2 shows the dependence of the light intensity on the time for this case. Table 2 shows the values of the extrema coordinates for this particular case.
3.1 Plot the dependence of the mirror coordinates , at which the intensity is extreme, as a function of the number of the extremum .
3.2 Using the plotted graph, determine with maximum accuracy the value of the wavelength of the light source. Estimate the error of the obtained value.
4. Two monochromatic waves
The interferometer is illuminated by radiation containing two monochromatic waves. The wavelength of one of them is , and the wavelength of the second is unknown.
Figure 3 shows the dependence of the light intensity on the screen as a function of the time. Table 3 shows the values of the extrema for this particular case.
4.1 Using the given data, determine with maximum accuracy the wavelength of the second spectral component. Estimate the error of the found value of the wavelength.
4.2 Determine the ratio of the intensities of the second and first waves .
¹ This problem is developed on the basis of the article « Homemade Fourier spectrometer» (https://habr.com/ru/post/253947/).
Figures 1–3 and Tables 1–3 were given on separate Writing sheets and are not in the official PDF.