PARTE 1. Voltaggio e flusso di energia radiante
1.1 – Misura le distanze da giunzione a giunzione di sorgente e sensore e registrale insieme con i voltaggi corrispondenti. Esponi sinteticamente il procedimento.
(Varia la distanza tra sorgente e sensore entro un massimo di 40 cm; la sorgente è il LED giallo con resistore da 470 Ω collegato alla batteria da 4.5 V; il sensore è il LED giallo collegato al voltmetro sulla portata di 2 V. I due LED devono essere affacciati con le lenti sullo stesso asse longitudinale.)
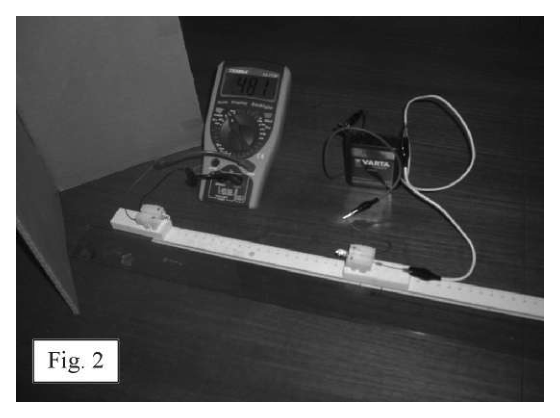 Figura 2: setup sorgente e sensore LED
Topic: Geometric Optics, Circuits, Electromagnetic Induction Metodi: Experimental Data Analysis, Physical Modeling, Kinematic Equations Competenze: Experimental Data Analysis, Measurement & Instrumentation Objects: Resistor, Battery, Lens Fonte: Testo (PDF) — p.2 Soluzione: Soluzioni (PDF)
The following information is provided: Voltage and flow of radiant energy**
1.1 Measure the junction to source and sensor junction distances and record them together with the corresponding voltages. You briefly explain the procedure.
(Variate the distance between source and sensor within a maximum of 40 cm; source is the yellow LED with 470 Ω resistor connected to the 4.5 V battery; sensor is the yellow LED connected to the voltmeter on the power of 2 V. The two LEDs shall be faced with the lenses on the same longitudinal axis.)
Figure 2: source setup and LED sensor
Topic: Geometric Optics, Circuits, Electromagnetic Induction Metodi: Experimental Data Analysis, Physical Modeling, Kinematic Equations Competenze: Experimental Data Analysis, Measurement & Instrumentation Objects: Resistor, Battery, Lens Fonte: Testo (PDF) — p.2 Soluzione: Soluzioni (PDF)
1.2 – Analizzando l’andamento del voltaggio in funzione dell’inverso del quadrato della distanza, determina un intervallo di valori della distanza tra sensore e sorgente in cui ci si avvicina maggiormente ad una relazione di dipendenza lineare tra voltaggio e flusso radiante . L’intervallo deve avere un’ampiezza di almeno 10 cm. Quale intervallo scegli? Esponi sinteticamente il criterio di scelta.
(Si suppone che il flusso radiante sul sensore sia inversamente proporzionale al quadrato della distanza dalla sorgente: . La relazione di linearità va verificata nell’intervallo di distanze scelto.)
Topic: Geometric Optics, Electrostatics Metodi: Graph Linearization, Experimental Data Analysis, Physical Modeling Competenze: Graph Linearization, Experimental Data Analysis Objects: — Fonte: Testo (PDF) — p.2 Soluzione: Soluzioni (PDF)
1.2 By analysing the voltage trend in relation to the inverse of the distance square, a range of sensor-source distance values is determined where a linear relationship of dependence between voltage and radiant flow is closest. The range shall be at least 10 cm wide. What interval do you choose? You summarize the choice criteria.
(The radiant flow on the sensor is assumed to be inversely proportional to the square of the distance from the source: . The linearity ratio shall be checked in the range of distances chosen.)
Topic: Geometric Optics, Electrostatics Metodi: Graph Linearization, Experimental Data Analysis, Physical Modeling Competenze: Graph Linearization, Experimental Data Analysis Objects: — Fonte: Testo (PDF) — p.2 Soluzione: Soluzioni (PDF)
PARTE 2. Flusso di energia attraverso il vetro
2.1 – Registra le posizioni delle giunzioni di sorgente e sensore, e della prima faccia del primo vetrino, cioè di quello rivolto verso la sorgente, leggendole sulla riga o sul nastro millimetrato.
(Poni sorgente e sensore affacciati ad una distanza compresa nell’intervallo di linearità trovato al punto 1.2. Inserisci tra sorgente e sensore un numero variabile di vetrini porta oggetto da microscopio, con gli spigoli di 2 cm verticali, mantenuti perpendicolari all’asse tra i due LED per mezzo di due mollette da bucato.)
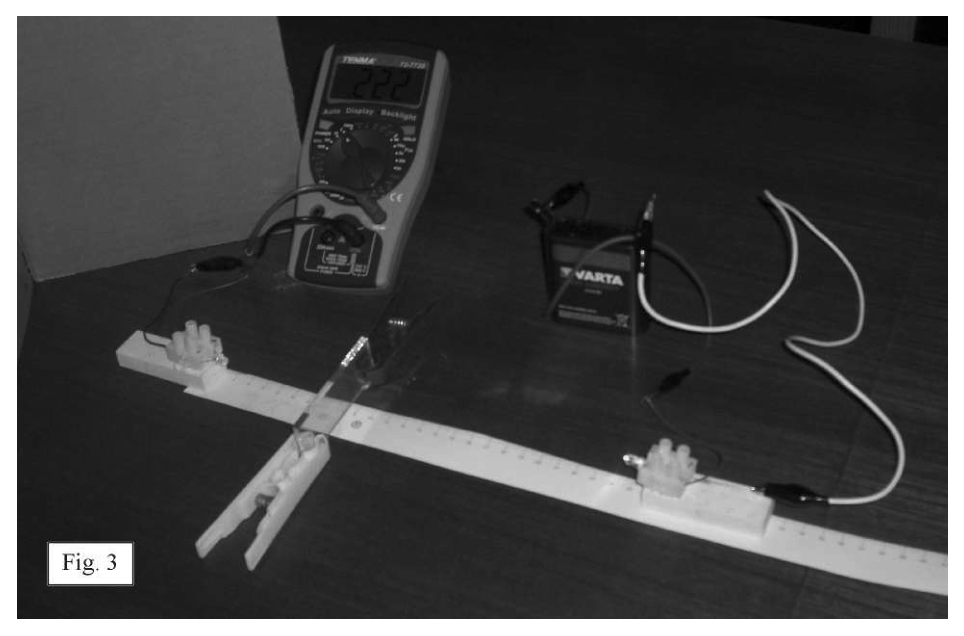 Figura 3: setup con vetrini interposti
Topic: Geometric Optics, Wave Optics Metodi: Experimental Data Analysis, Physical Modeling Competenze: Measurement & Instrumentation, Experimental Data Analysis Objects: — Fonte: Testo (PDF) — p.3 Soluzione: Soluzioni (PDF)
The following information is provided for in Part II: Energy flow through glass**
2.1 Record the positions of the source and sensor joints and the front face of the first window, that is, the one facing the source, by reading them on the line or on the millimeter tape.
(Puts the source and sensor facing a distance within the linearity range found in point 1.2. Insert a variable number of microscopic port windows between the source and sensor, with the 2 cm vertical pins, held perpendicular to the axis between the two LEDs by means of two washing sockets.)
Figure 3: Setup with interlocking windows
Topic: Geometric Optics, Wave Optics Metodi: Experimental Data Analysis, Physical Modeling Competenze: Measurement & Instrumentation, Experimental Data Analysis Objects: — Fonte: Testo (PDF) — p.3 Soluzione: Soluzioni (PDF)
2.2 – Effettua e registra le misure di voltaggio ai capi del sensore in funzione del numero , da 0 a 10, di vetrini interposti tra sorgente e sensore.
Topic: Geometric Optics, Wave Optics Metodi: Experimental Data Analysis, Physical Modeling Competenze: Experimental Data Analysis, Measurement & Instrumentation Objects: — Fonte: Testo (PDF) — p.3 Soluzione: Soluzioni (PDF)
2.2 Measures and records the voltage at the sensor heads according to the number , 0 to 10, of the windows between the source and sensor.
Topic: Geometric Optics, Wave Optics Metodi: Experimental Data Analysis, Physical Modeling Competenze: Experimental Data Analysis, Measurement & Instrumentation Objects: — Fonte: Testo (PDF) — p.3 Soluzione: Soluzioni (PDF)
2.3 – Per incidenza quasi normale della luce, come in questo caso, ciascuna faccia di ciascun vetrino riflette il 4% del flusso radiante incidente. In base a questa informazione e nell’ipotesi che si verifichi solamente il fenomeno della riflessione, esprimi con una formula il voltaggio al sensore in funzione del numero di vetrini.
Indica il procedimento seguito, precisa significato e valore della costante o delle costanti che compaiono nella formula.
(Ogni vetrino ha due facce, ciascuna delle quali riflette il 4% del flusso incidente, trasmettendo quindi il 96%. Con vetrini e facce, il flusso trasmesso è , e quindi .)
Topic: Wave Optics, Geometric Optics Metodi: Physical Modeling, Approximation & Series Expansion, Snell’s Law Competenze: Mathematical Modeling, Physical Reasoning Objects: — Fonte: Testo (PDF) — p.3 Soluzione: Soluzioni (PDF)
2.3 For near normal incidence of light, as in this case, each face of each window reflects 4% of the incident radiant flow. Based on this information and assuming that only the reflection phenomenon occurs, express the sensor voltage in a formula according to the number of windows .
Indicates the procedure followed, specifies the meaning and value of the constant or constants that appear in the formula.
Each window has two faces, each of which reflects 4% of the incident flow, thus transmitting 96%. With windows and faces, the flow is , and then .)*
Topic: Wave Optics, Geometric Optics Metodi: Physical Modeling, Approximation & Series Expansion, Snell’s Law Competenze: Mathematical Modeling, Physical Reasoning Objects: — Fonte: Testo (PDF) — p.3 Soluzione: Soluzioni (PDF)
2.4 – Confronta i valori di calcolati attraverso la formula con quelli misurati al punto 2.2. Da questo confronto, deduci se l’effetto complessivo di rifrazione e assorbimento sul flusso di energia radiante sul sensore è o non è significativo, tenuto conto delle incertezze di misura.
Topic: Wave Optics, Geometric Optics Metodi: Experimental Data Analysis, Error Propagation, Physical Modeling Competenze: Experimental Data Analysis, Physical Reasoning Objects: — Fonte: Testo (PDF) — p.4 Soluzione: Soluzioni (PDF)
2.4 Compare the values of calculated using the formula with those measured in point 2.2. From this comparison, deduce whether the overall effect of refraction and absorption on the radiant energy flow on the sensor is significant or not, given the measurement uncertainties.
Topic: Wave Optics, Geometric Optics Metodi: Experimental Data Analysis, Error Propagation, Physical Modeling Competenze: Experimental Data Analysis, Physical Reasoning Objects: — Fonte: Testo (PDF) — p.4 Soluzione: Soluzioni (PDF)
PARTE 3. Lunghezza d’onda della radiazione IR
3.1 – Dalle posizioni sul goniometro dei massimi di luce gialla ricava il passo del reticolo. Descrivi brevemente il procedimento seguito.
(Usa il reticolo di diffrazione trasparente (settore di CD) con il LED giallo sorgente. I massimi di luce di ordine () si trovano nelle direzioni formanti angoli con la normale al reticolo, per cui vale la relazione:
La lunghezza d’onda centrale della banda emessa dal LED giallo è m. Con visuale radente al foglio, traguarda verso il reticolo attraverso gli spilli e segnane le posizioni dei massimi sul goniometro.)
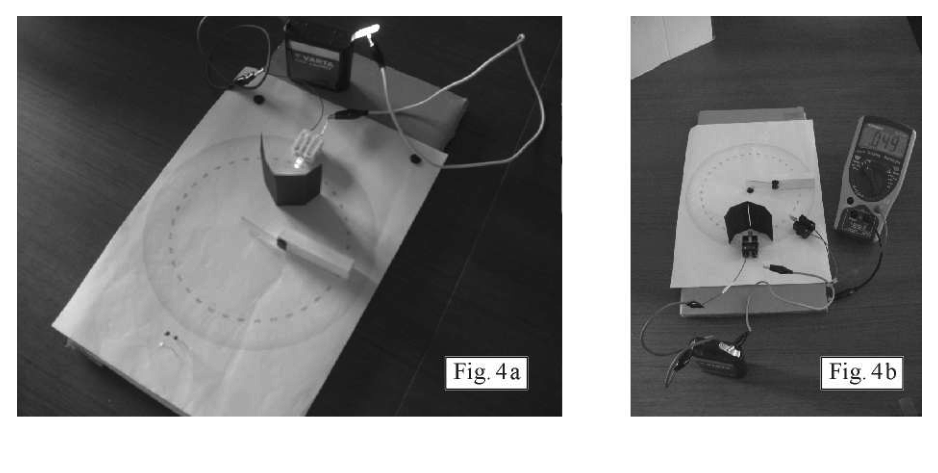 Figura 4a/4b: apparato con reticolo di diffrazione
Topic: Wave Optics, Geometric Optics Metodi: Interference & Diffraction Analysis, Experimental Data Analysis, Physical Modeling Competenze: Experimental Data Analysis, Measurement & Instrumentation Objects: Diffraction Grating Fonte: Testo (PDF) — p.4 Soluzione: Soluzioni (PDF)
The following information is provided by the Commission: Wavelength of IR radiation**
**3.1 ** From the positions on the goniometer of the yellow light maximum the of the reticulum is obtained. Please describe briefly the procedure followed.
Use the transparent diffraction lattice (CD sector) with the source yellow LED. The light masses of order () are in the directions forming angles with the normal to the lattice, so the ratio is:*
The mean wavelength of the yellow LED is m. With a paper-like view, aim for the lattice through the spikes and mark the positions of the maxims on the goniometer.)*
*Figure 4a/4b: apparatus with diffraction lattice *
Topic: Wave Optics, Geometric Optics Metodi: Interference & Diffraction Analysis, Experimental Data Analysis, Physical Modeling Competenze: Experimental Data Analysis, Measurement & Instrumentation Objects: Diffraction Grating Fonte: Testo (PDF) — p.4 Soluzione: Soluzioni (PDF)
3.2 – Dalle angolazioni dei massimi della radiazione IR, ricava la lunghezza d’onda centrale della banda di radiazioni emessa dal LED IR. Descrivi brevemente il procedimento seguito.
(Sostituisci il reticolo trasparente con quello a specchio (reticolo riflettente), il LED giallo sorgente con il LED IR sorgente (quello con il resistore, su connettori neri). Il LED IR sensore rileva i massimi di radiazione al posto degli occhi. Sorgente e sensore si trovano dalla stessa parte rispetto al reticolo. La striscia di acetato fissata con una puntina nel centro del goniometro serve come appoggio girevole per il supporto del sensore. Usa la stessa relazione con il passo determinato al punto 3.1 per ricavare .)
Topic: Wave Optics, Modern-Quantum Physics Metodi: Interference & Diffraction Analysis, Experimental Data Analysis, Physical Modeling Competenze: Experimental Data Analysis, Physical Reasoning Objects: Diffraction Grating Fonte: Testo (PDF) — p.5 Soluzione: Soluzioni (PDF)
3.2 From the angles of the IR radiation peaks, it derives the central wavelength of the radiation band emitted by the IR LED. Please describe briefly the procedure followed.
Replace the transparent mesh with the mirror mesh (reflective mesh), the source yellow LED with the source IR LED (the one with the resistor, on black connectors). The LED IR sensor detects the maximum radiation in place of the eyes. The source and sensor are on the same side as the lattice. The acetate strip fixed with a point in the centre of the goniometer serves as a rotating support for the sensor support. Use the same ratio with the step determined in paragraph 3.1 to obtain .)*
Topic: Wave Optics, Modern-Quantum Physics Metodi: Interference & Diffraction Analysis, Experimental Data Analysis, Physical Modeling Competenze: Experimental Data Analysis, Physical Reasoning Objects: Diffraction Grating Fonte: Testo (PDF) — p.5 Soluzione: Soluzioni (PDF)