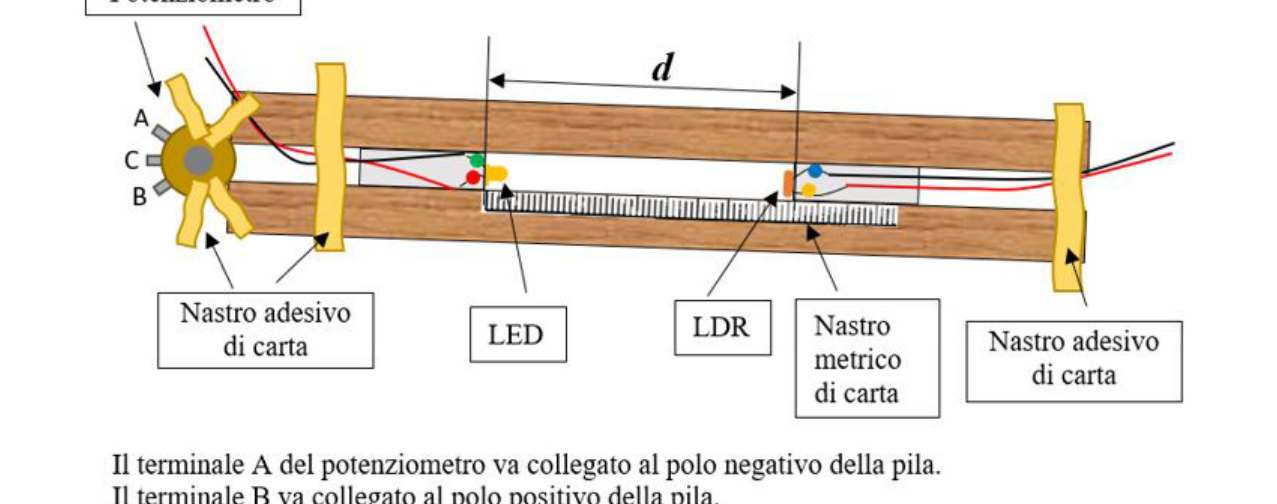
Q.1 [40 p.] Agendo sul potenziometro effettua misure di intensità di corrente i e tensione V ai capi del LED e del corrispondente valore della resistenza R del fotoresistore (previo uso dello schermaggio). Effettua un congruo numero di misure per valori di i tali che 10 mA < i < 100 mA. Esprimi l’intensità di corrente in mA; la tensione in V e la resistenza in kΩ. Riporta in tabella le misure ottenute e descrivi le modalità con cui hai deciso di impostare il passo delle misure. Per definire, in termini della resistenza R, una grandezza che sia un buon indicatore della potenza della luce emessa dal LED si avanzano due ipotesi. La prima è che la luce sia distribuita uniformemente all’interno del cono di luce che esce dal LED e quindi che la sua intensità diminuisca con l’inverso del quadrato della distanza dal vertice: indicando con h l’altezza del cono di luce nel punto in cui si trova l’LDR ne segue che . La seconda è che, limitatamente all’intervallo di valori R realizzato in Q1, la relazione tra le due grandezze sia di proporzionalità inversa: . Se le due ipotesi sono entrambe valide allora deve risultare 1/R = k/h2 (1) La validità della (1) va verificata! Se la verifica darà esito positivo si potrà definire = 1/R quale indicatore della potenza della luce irradiata dal LED. Le caratteristiche geometriche del cono di luce emesso dal LED sono determinate dalle proprietà ottiche delle parti che costituiscono il dispositivo e, di conseguenza, la posizione del vertice del cono non coincide necessariamente con un punto appartenente al LED. Pertanto, l’altezza h del cono di luce che investe l’LDR non può essere misurata direttamente. È invece facilmente misurabile la distanza d tra i due supporti in gomma su cui sono montati LED e LDR (vedi Fig.6). La relazione tra l’altezza h del cono di luce e la distanza d è h = d + D, essendo D una distanza che dipende dall’ottica del LED e dalle condizioni di lavoro del fotoresistore utilizzato.
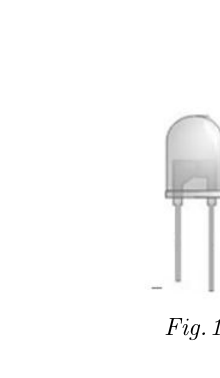
p.3 — Fig.1a LED reale con elettrodi
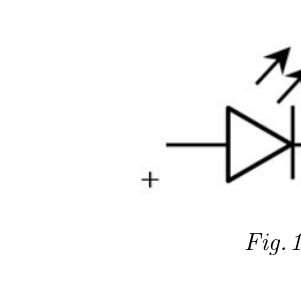
p.3 — Fig.1b simbolo elettrico del LED
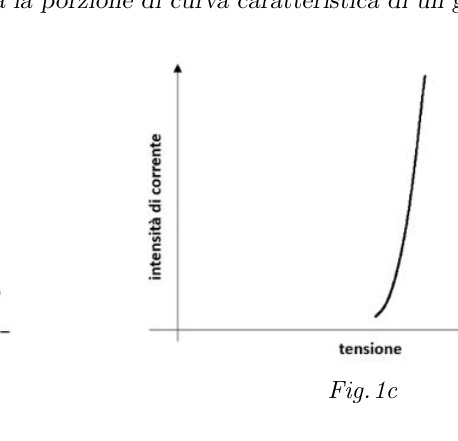
p.3 — Fig.1c curva caratteristica del LED
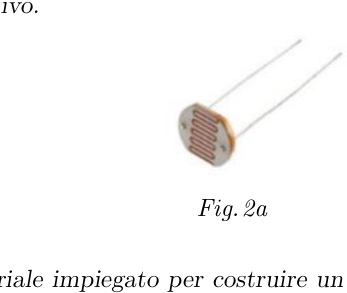
p.3 — Fig.2a fotoresistore LDR reale
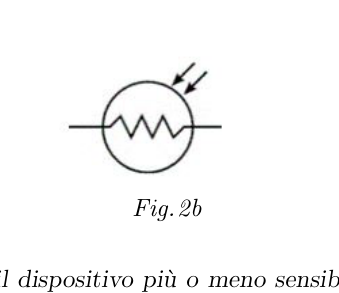
p.3 — Fig.2b simbolo elettrico dell’LDR
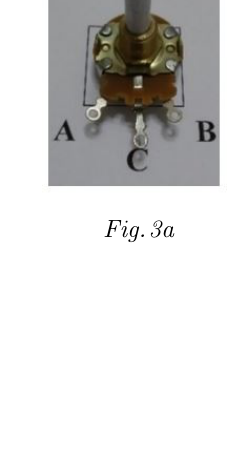
p.4 — Fig.3a potenziometro reale
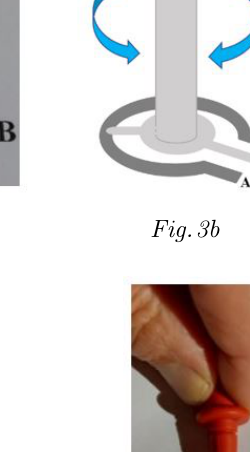
p.4 — Fig.3b rotazione cursore potenziometro
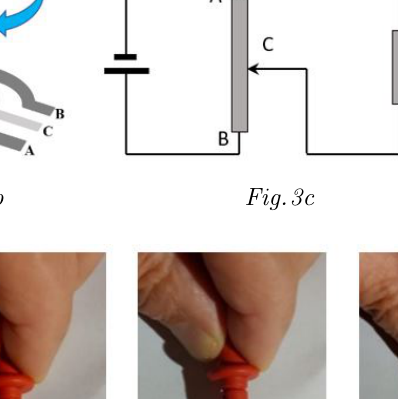
p.4 — Fig.3c schema partitore di tensione
p.4 — Fig.3d schema resistenze RAC RBC
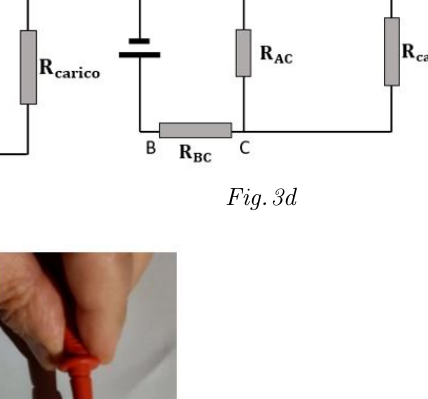
p.4 — Fig.4a collegamento spinotti a banana
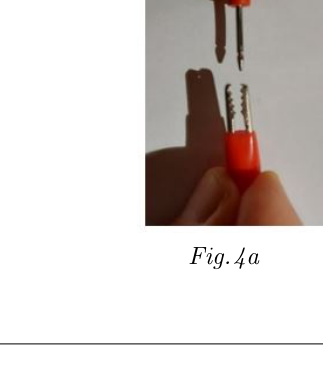
p.4 — Fig.4b collegamento spinotti a banana
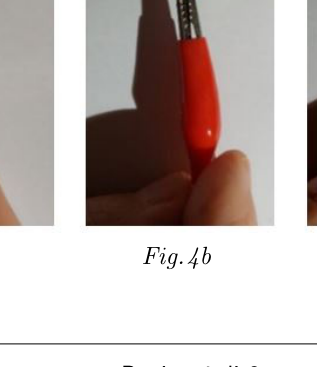
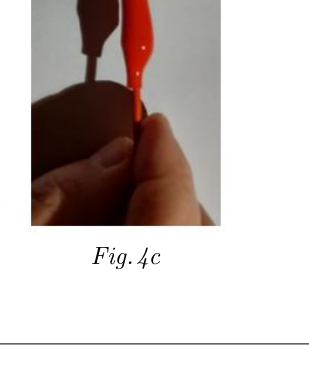
p.4 — Fig.4c collegamento spinotti a banana
p.5 — Fig.5a montaggio LED su gomma
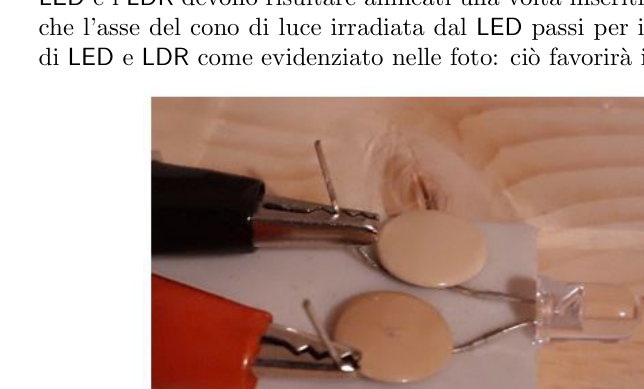
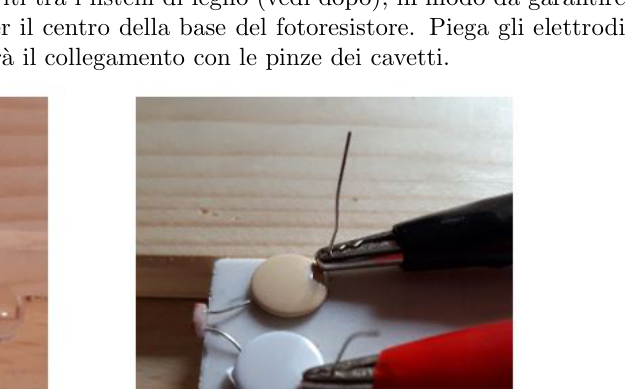
p.5 — Fig.5b montaggio LDR su gomma
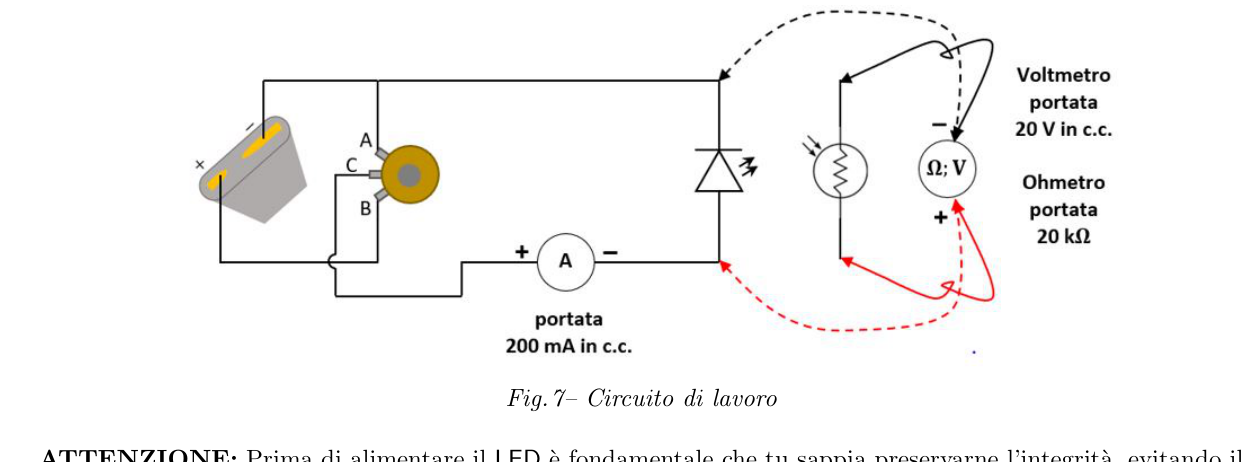
p.6 — Fig.7 circuito di lavoro completo
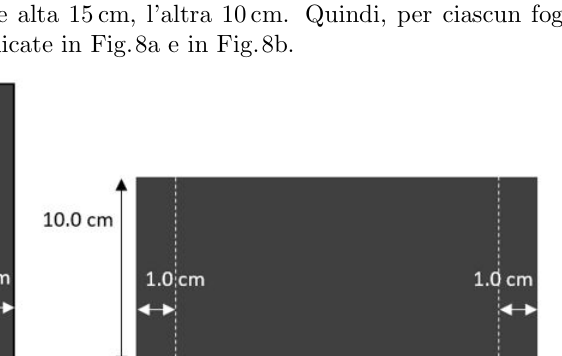
p.6 — Fig.8a striscia cartoncino con pieghe
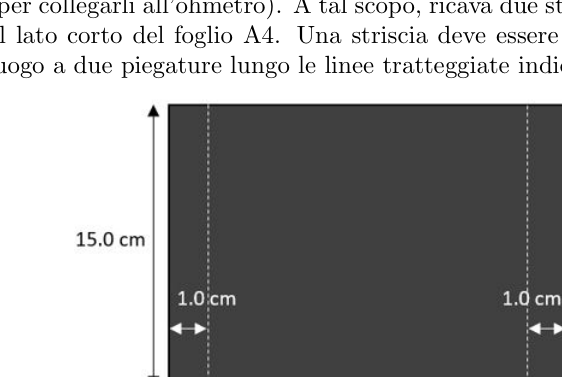
p.6 — Fig.8b striscia cartoncino con pieghe
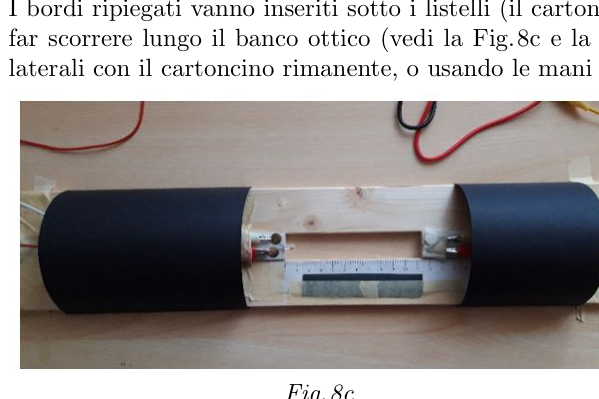
p.6 — Fig.8c schermaggio montato sul banco
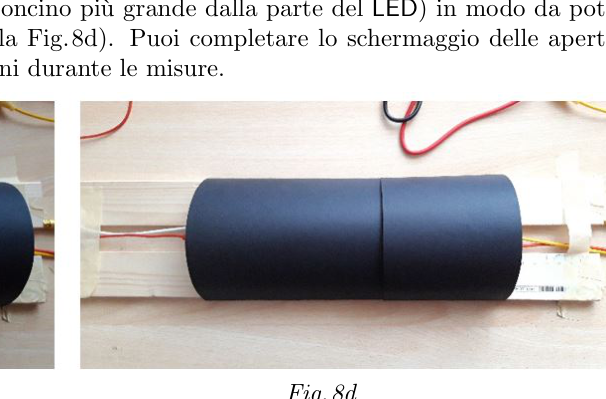
p.6 — Fig.8d schermaggio montato sul banco
Topic: Circuits, Geometric Optics, Electromagnetism Metodi: Experimental Data Analysis, Physical Modeling, Graph Linearization Competenze: Experimental Data Analysis, Measurement & Instrumentation, Physical Reasoning Objects: Resistor Fonte: Testo (PDF) — p.7 Soluzione: Soluzioni (PDF)
Q.1 [40 p.] By acting on the power meter it measures the current intensity i and voltage V of the LED heads and the corresponding R-resistance value of the photoresistors (after screening). Effects an appropriate number of measurements for values of such as 10 mA < i < 100 mA. Express the intensity of current in mA; voltage in V and resistance in kΩ. Table showing the measures obtained and description the manner in which you decided to set the step of the measures. To define, in terms of resistance R, a magnitude which is a good indicator of the light power The LEDs are two things. The first is that the light is evenly distributed within the The light cone that comes out of the LED and therefore its intensity decreases with the inverse of the square of the distance From the top: h indicating the height of the light cone at the point where the LLDR is located, it follows that . La The second is that, limited to the range of R values achieved in Q1, the relationship between the two quantities is is of reverse proportionality: . If both hypotheses are valid then it must be 1/R = k/h2 (1) The validity of (1) must be verified! If the test results are positive, = 1/R can be defined as an indicator. the power of the light emitted by the LED. The geometrical characteristics of the cone of light emitted by the LED are determined by the optical properties the parts which constitute the device and, consequently, the position of the cone top does not coincide necessarily with a point that belongs to the LED. Therefore, the h height of the light cone that involves the LDR does not can be measured directly. The distance d between the two rubber bearings can be easily measured. on which LEDs and LDRs are mounted (see Fig.6). The ratio of the height h of the light cone to the distance d is h = d + D, whereas D is a distance that depends on the LED’s optics and the working conditions of the photoresistors used.
The following table shows the results of the calculations:
The LED shall be designed to be capable of operating at a temperature of at least 30 °C.
The following table shows the characteristics of the LED:
The manufacturer shall ensure that the manufacturer is able to provide the necessary information to the manufacturer.
The following table shows the number of units of the LDR:
The value of the underlying assets shall be calculated on the basis of the following data:
The following table shows the results of the calculations:
The following table shows the results of the calculations:
The following table shows the results of the tests:
The following table shows the total number of banana spikes in the Union:
The following table shows the results of the analysis of the results of the studies:
The following table shows the results of the analysis of the results of the studies:
The following table shows the results of the tests:
The following conditions shall apply:
The following table shows the total number of units of the manufacturer’s manufacturer’s product:
The following table shows the number of cases of the case:
**p.6 ** Fig.8b carton strip with folds
The following table shows the number of units in the vehicle:
The manufacturer shall ensure that the manufacturer is able to provide the manufacturer with the necessary information and that the manufacturer is able to provide the manufacturer with the necessary information and that the manufacturer is able to provide the manufacturer with the necessary information and that the manufacturer is able to provide the manufacturer with the necessary information and that the manufacturer is able to provide the manufacturer with the necessary information and that the manufacturer is able to provide the necessary information and that the manufacturer is able to provide the necessary information and that the manufacturer is able to provide the necessary information and that the manufacturer is able to provide the necessary information.
Topic: Circuits, Geometric Optics, Electromagnetism Metodi: Experimental Data Analysis, Physical Modeling, Graph Linearization Competenze: Experimental Data Analysis, Measurement & Instrumentation, Physical Reasoning Objects: Resistor Fonte: Testo (PDF) — p.7 Soluzione: Soluzioni (PDF)
Q.2 [72 p.] Progetta, e descrivi, un protocollo atto a verificare la validità della (1) e a misurare la distanza D e la costante k. Dichiara il valore della corrente elettrica i usata per effettuare le misure. Motivane la scelta. È espressamente richiesta la costruzione di un grafico. Riporta in tabella le misure effettuate e dichiara i valori ottenuti di D e k.
p.5 — Fig.6 banco ottico con distanza d
Topic: Circuits, Geometric Optics Metodi: Graph Linearization, Experimental Data Analysis, Physical Modeling Competenze: Experimental Data Analysis, Graph Linearization, Mathematical Modeling Objects: Resistor Fonte: Testo (PDF) — p.7 Soluzione: Soluzioni (PDF)
Q.2 [72 p.] Describe and design a protocol to verify the validity of (1) and measure the distance D and the constant k. Declare the value of the electric current used to carry out the measurements. The reasons for this The choice. The construction of a graph is expressly required. Table showing the measures taken and declares the values of D and k.
The following table shows the results of the tests:
Topic: Circuits, Geometric Optics Metodi: Graph Linearization, Experimental Data Analysis, Physical Modeling Competenze: Experimental Data Analysis, Graph Linearization, Mathematical Modeling Objects: Resistor Fonte: Testo (PDF) — p.7 Soluzione: Soluzioni (PDF)
Q.3 [14 p.] Elabora le misure ottenute in Q1 in modo da associare ad ogni valore di P espresso in mW il corrispondente valore assunto da espresso in . Riporta i risultati in un’apposita tabella. Infine, costruisci il grafico = f(P). Il LED non è in grado di convertire tutta la potenza elettrica P in potenza da associare alla luce che irradia. Volendo studiare questo aspetto del problema si considera il rapporto = come indicatore del rendimento del LED.
Topic: Circuits, Geometric Optics Metodi: Experimental Data Analysis, Physical Modeling Competenze: Experimental Data Analysis, Graph Linearization, Physical Reasoning Objects: Resistor Fonte: Testo (PDF) — p.7 Soluzione: Soluzioni (PDF)
Q.3 [14 p.] It shall draw up the measurements obtained in Q1 so that it associates with each P value expressed in mW the the corresponding value taken from expressed in . Report the results in a table. Finally, build the graph = f(P). The LED is not able to convert all the electrical power P into power to be associated with the light it radiates. In order to study this aspect of the problem, the ratio = is considered as an indicator of performance. The LED.
Topic: Circuits, Geometric Optics Metodi: Experimental Data Analysis, Physical Modeling Competenze: Experimental Data Analysis, Graph Linearization, Physical Reasoning Objects: Resistor Fonte: Testo (PDF) — p.7 Soluzione: Soluzioni (PDF)
Q.4 [12 p.] Per ogni valore di P, calcolato in precedenza, calcola il valore del rapporto corrispondente. Riporta i risultati completando la tabella costruita in Q3. Costruisci, infine, il grafico = f(P). — Pagina 7 di 8 — AIF – Campionati di Fisica 2023 Gara Nazionale – 13 Aprile 2023 Prova Sperimentale
Topic: Circuits, Geometric Optics Metodi: Experimental Data Analysis, Physical Modeling Competenze: Experimental Data Analysis, Graph Linearization, Physical Reasoning Objects: Resistor Fonte: Testo (PDF) — p.7 Soluzione: Soluzioni (PDF)
Q.4 [12 p.] For each value of P previously calculated, calculate the corresponding ratio. Reporting The results are completed by completing the table constructed in Q3. Finally, build the graph = f(P). Page 7 of 8 The European Commission has also adopted a number of measures to combat the spread of the virus. National competition 13 April 2023 Experimental Test
Topic: Circuits, Geometric Optics Metodi: Experimental Data Analysis, Physical Modeling Competenze: Experimental Data Analysis, Graph Linearization, Physical Reasoning Objects: Resistor Fonte: Testo (PDF) — p.7 Soluzione: Soluzioni (PDF)
Q.5 [34 p.] Costruisci un grafico per verificare se l’equazione empirica = (aP)/(P 3/2 + b) si accorda con i punti sperimentali. Dichiara gli estremi dell’intervallo dei valori della potenza P per cui l’accordo ritieni che sia verificato e calcola le costanti a e b.
Topic: Circuits, Geometric Optics Metodi: Experimental Data Analysis, Curve Fitting, Physical Modeling Competenze: Curve Fitting, Experimental Data Analysis, Mathematical Modeling Objects: Resistor Fonte: Testo (PDF) — p.8 Soluzione: Soluzioni (PDF)
Q.5 [34 p.] Build a graph to see if the empirical equation = (aP)/(P 3/2 + b) agrees with the The following points shall be added: Declares the extremes of the P-value range for which the agreement consider that it is verified and calculate constants a and b.
Topic: Circuits, Geometric Optics Metodi: Experimental Data Analysis, Curve Fitting, Physical Modeling Competenze: Curve Fitting, Experimental Data Analysis, Mathematical Modeling Objects: Resistor Fonte: Testo (PDF) — p.8 Soluzione: Soluzioni (PDF)
Q.6 [12 p.] Sfruttando l’equazione empirica introdotta in Q5 calcola il valore della potenza P per cui assume il massimo valore. Materiale elaborato dal Gruppo NOTA BENE È possibile utilizzare, riprodurre, distribuire, comunicare al pubblico questo materiale alle due seguenti condizioni: citare la fonte; non usare il materiale, nemmeno parzialmente, per fini commerciali. — Pagina 8 di 8 —
Topic: Circuits, Geometric Optics Metodi: Calculus-Integration, Physical Modeling, Approximation & Series Expansion Competenze: Mathematical Modeling, Physical Reasoning, Experimental Data Analysis Objects: Resistor Fonte: Testo (PDF) — p.8 Soluzione: Soluzioni (PDF)
Q.6 [12 p.] Using the empirical equation introduced in Q5, calculates the value of the power P for which assumes The maximum value. Material prepared by the Group Good note . You can use, reproduce, distribute, communicate this material to the public to the following two Conditions: citing the source; not using the material, even partially, for commercial purposes. Page 8 of 8
Topic: Circuits, Geometric Optics Metodi: Calculus-Integration, Physical Modeling, Approximation & Series Expansion Competenze: Mathematical Modeling, Physical Reasoning, Experimental Data Analysis Objects: Resistor Fonte: Testo (PDF) — p.8 Soluzione: Soluzioni (PDF)