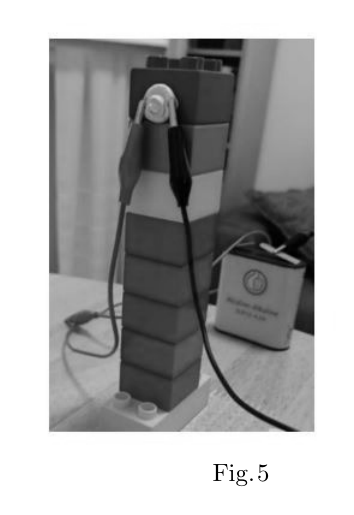
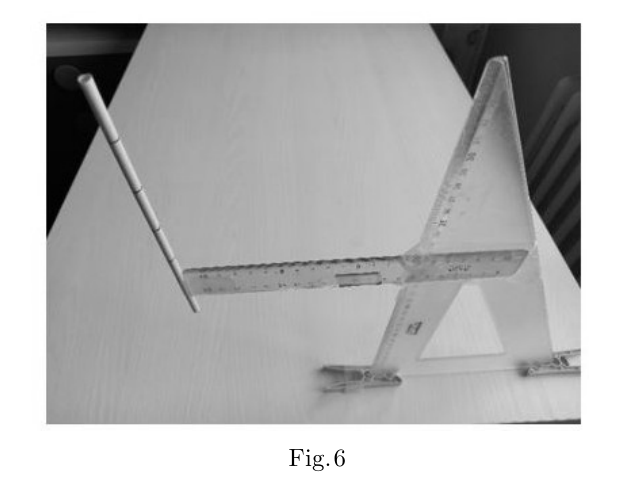
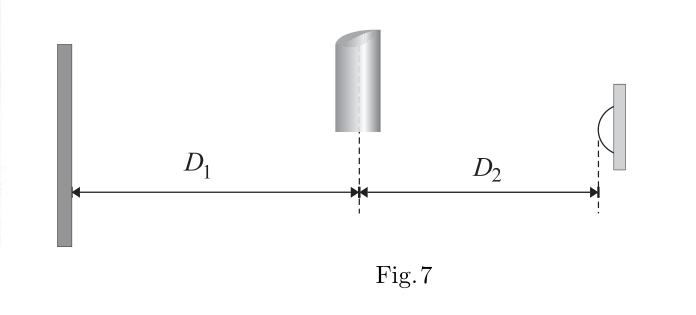
Q.1 [6 p.] Qual è la misura di lunghezza L di tale porzione di cannuccia? Stima l’incertezza. Usa tale porzione di cannuccia per rispondere al quesito successivo. In Fig.6 è suggerito come realizzare un sostegno della cannuccia usando il materiale a disposizione: fissa la cannuccia al righello con il nastro adesivo, curando l’operazione in modo che la cannuccia conservi la forma cilindrica iniziale. Abbi cura di fissare le mollette da bucato al tavolo impiegando il nastro adesivo in dotazione. Prima di montare la cannuccia sul sostegno usa il pennarello, con la dovuta cura, per segnare su di essa i punti che distano 16.0 cm; 13.0 cm; 10.0 cm e 7.0 cm dall’estremità inferiore della cannuccia stessa. Tali punti risulteranno un utile riferimento per tagliare la cannuccia come previsto nel quesito Q.4. La distanza tra l’estremo inferiore della cannuccia e il piano di lavoro deve risultare uguale a 16.5 cm. La distanza D2 deve essere misurata dall’asse di simmetria cilindrica della cannuccia fino al vertice della calotta trasparente del LED (Fig.7). Raccomandazioni: proteggi il banco di lavoro sottostante la cannuccia mediante la carta assorbente; chiudi il flacone contenente acqua saponata quando non produci le bolle di sapone. Prendi confidenza con la realizzazione delle bolle prima di passare all’esecuzione delle misure vere e proprie. Ciò ti permetterà di effettuare tutti i controlli necessari per curare il giusto assetto dell’apparato di misura.
p.4 — Geometria proiezione ombra bolla
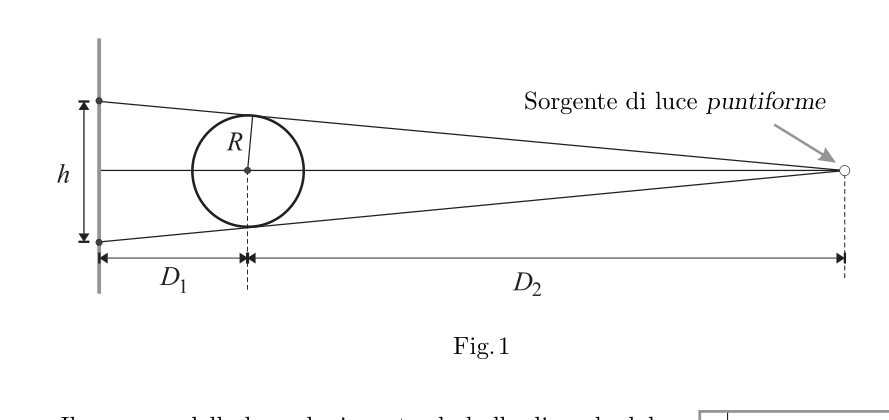
p.4 — Schema dimensione h dell’ombra
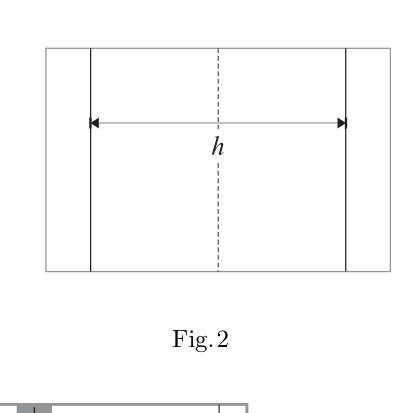
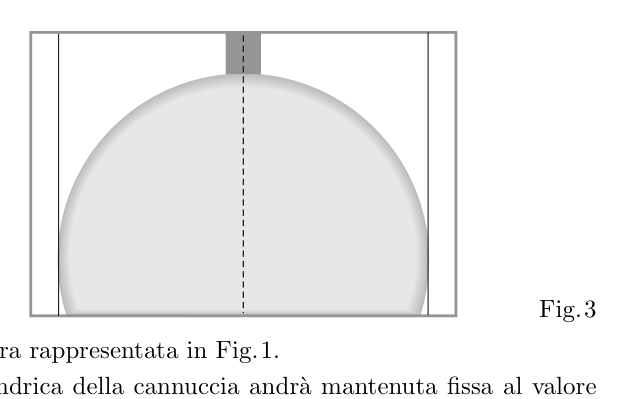
p.4 — Ombra della bolla sullo schermo
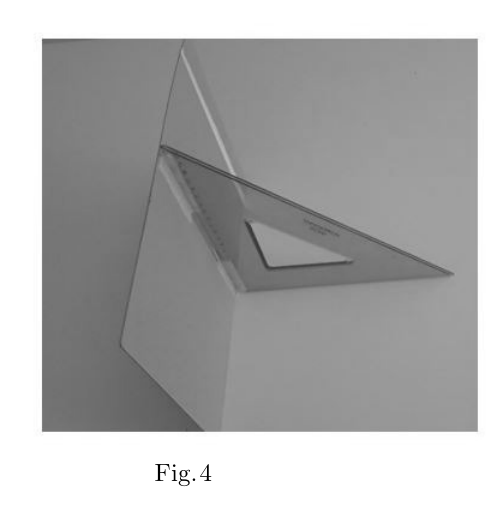
p.4 — Squadra e righello di sostegno
p.4 — Sorgente di luce a LED
p.5 — Sostegno della cannuccia sul righello
p.5 — Schema distanze D1 e D2
p.8 — Cronometro con tasti A, B, C
Topic: Fluid Mechanics, Oscillations & Waves Metodi: Physical Modeling, Experimental Data Analysis, Error Propagation Competenze: Measurement & Instrumentation, Experimental Data Analysis, Error Propagation Objects: Bubble, Tube Fonte: Testo (PDF) — p.5 Soluzione: Soluzioni (PDF)
Q.1 [6 p.] What is the length L of that portion of straw? He estimates the uncertainty. Use that portion of cane to answer the next question. Figure 6 suggests how to make a straw support using the material available: straw to the reel with the adhesive tape, curing the operation so that the straw retains its shape The initial cylinder. Make sure to fix the laundry springs to the table using the equipment tape. Before mounting the straw on the support, use the pin with due care to mark the points which are 16,0 cm, 13,0 cm, 10,0 cm and 7,0 cm apart from the lower end of the cane itself. These points They shall be a useful reference for cutting the cane as provided for in question Q.4. The distance between The lower end of the cane and the working plane shall be equal to 16.5 cm. The distance D2 shall be measured from the cylindrical symmetry axis of the straw to the top of the The LED transparent coating (Fig.7). Recommendations: protect the workbench under the straw with absorbent paper; close the bottle of soap water when you do not produce soap bubbles. Be confident about the bubble before you go to the actual measures. This will allow you to carry out all the checks necessary to maintain the correct layout of the measuring device.
The following table shows the results of the calculations:
The following is the list of the dimensions of the shadow:
The following table shows the number of samples taken from the sample:
**p.4 ** Support team and rack
The following conditions shall apply:
**p.5 ** Canker support on the reel
The following table shows the following:
The following table shows the number of days in which the time limit for the period of the test is fixed:
Topic: Fluid Mechanics, Oscillations & Waves Metodi: Physical Modeling, Experimental Data Analysis, Error Propagation Competenze: Measurement & Instrumentation, Experimental Data Analysis, Error Propagation Objects: Bubble, Tube Fonte: Testo (PDF) — p.5 Soluzione: Soluzioni (PDF)
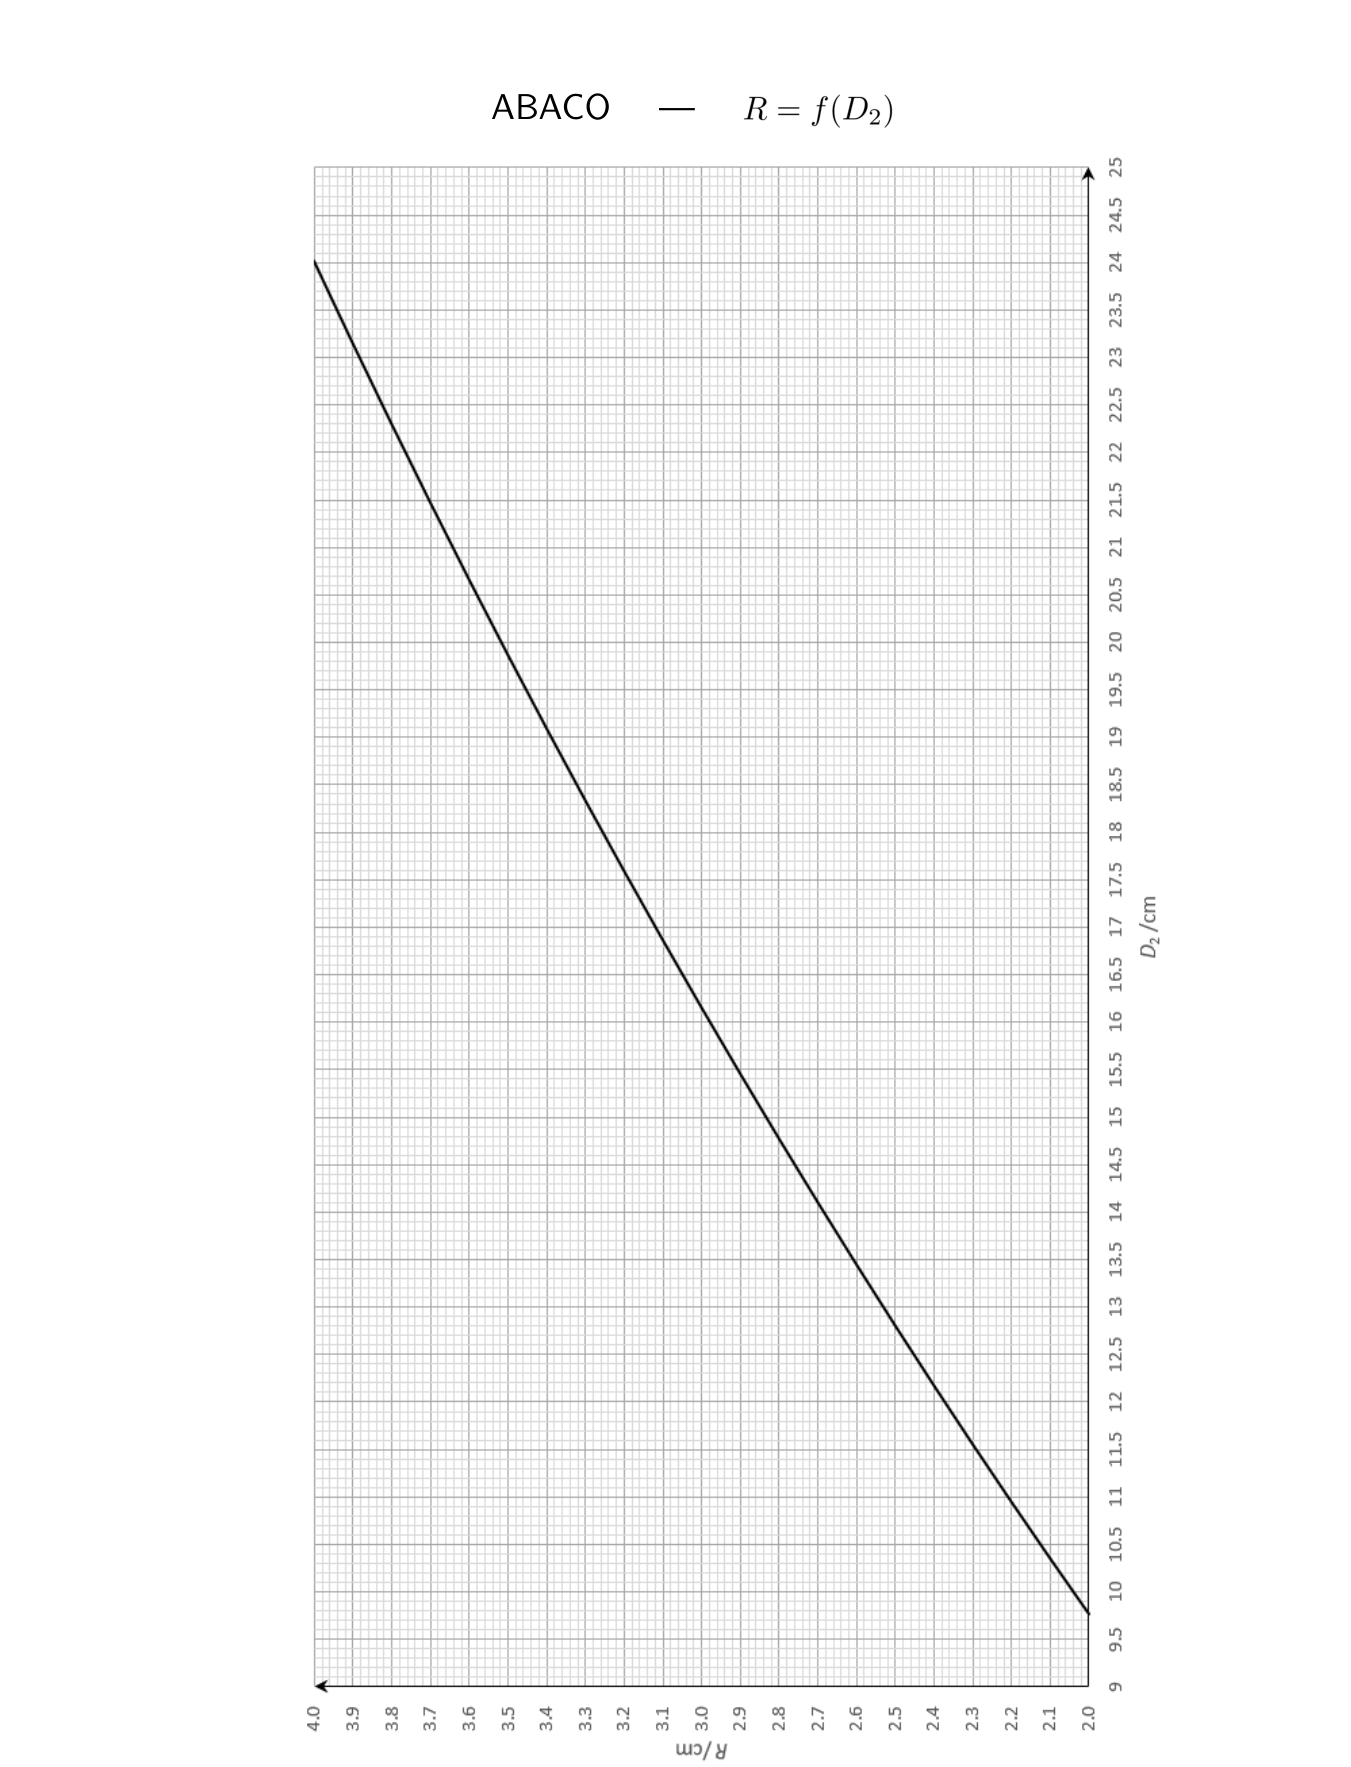
Q.2 [47 p.] Mediando su almeno 8 prove, misura il tempo di sgonfiamento t della bolla in funzione di R, per valori di R uguali a 2.0 cm; 2.5 cm; 3.0 cm; 3.5 cm e 4.0 cm. Riporta in tabella i risultati, specificando i valori di D2 utilizzati. Stima l’incertezza da associare alla misura del raggio R.
p.7 — Abaco R in funzione di D2
Topic: Fluid Mechanics Metodi: Experimental Data Analysis, Statistical Averaging, Physical Modeling Competenze: Measurement & Instrumentation, Experimental Data Analysis, Error Propagation Objects: Bubble, Tube Fonte: Testo (PDF) — p.5 Soluzione: Soluzioni (PDF)
Q.2 [47 p.] Using at least 8 tests, measure the bulb’s time of inflation t in R, for R values equal to 2.0 cm; 2.5 cm; 3.0 cm; 3.5 cm and 4.0 cm. Report the results in the table, specifying the values of D2 used. Estimate the uncertainty associated with the measurement of the R-ray.
The following table shows the following information:
Topic: Fluid Mechanics Metodi: Experimental Data Analysis, Statistical Averaging, Physical Modeling Competenze: Measurement & Instrumentation, Experimental Data Analysis, Error Propagation Objects: Bubble, Tube Fonte: Testo (PDF) — p.5 Soluzione: Soluzioni (PDF)
Q.3 [18 p.] Costruisci il grafico t = f1(R). — Pagina 5 di 8 — AIF – Campionati di Fisica 2025 Gara Nazionale – 10 Aprile 2025 – Prova Sperimentale
Topic: Fluid Mechanics Metodi: Experimental Data Analysis, Physical Modeling Competenze: Graph Linearization, Experimental Data Analysis, Mathematical Modeling Objects: Bubble Fonte: Testo (PDF) — p.5 Soluzione: Soluzioni (PDF)
Q.3 [18 p.] You build the graph t = f1(R. Page 5 of 8 AIF Physics Championships 2025 National competition 10 April 2025 Experimental test
Topic: Fluid Mechanics Metodi: Experimental Data Analysis, Physical Modeling Competenze: Graph Linearization, Experimental Data Analysis, Mathematical Modeling Objects: Bubble Fonte: Testo (PDF) — p.5 Soluzione: Soluzioni (PDF)
Q.4 [34 p.] Mantenendo fisso il raggio iniziale della bolla R = 3.0 cm, e mediando su almeno 8 prove, misura il tempo di sgonfiamento t al variare della lunghezza L della cannuccia. Usa le forbici per impostare le seguenti lunghezze L, oltre a quella usata per rispondere ai quesiti precedenti: 16.0 cm; 13.0 cm; 10.0 cm; 7.0 cm. Prima di effettuare le misure assicurati che il bordo tagliato abbia la forma circolare. Verifica la compatibilità tra le misure ottenute e l’ipotesi che la relazione t = f2(L) sia di tipo lineare. Quantifica i parametri costanti che la caratterizzano. La relazione t = f2(L) mette in evidenza gli effetti della viscosità sul flusso del fluido dentro la cannuccia. Se non ci fossero perdite di energia causate dalla viscosità tutta l’energia potenziale, inizialmente immagazzinata sulla superficie della bolla, verrebbe gradualmente ceduta all’aria in uscita sotto forma di energia cinetica. Ciò, al limite, accadrebbe se la bolla venisse lasciata sgonfiare attraverso un anello sottile (L = 0) di raggio r uguale al raggio interno della cannuccia. Per tale ipotesi è possibile dimostrare che la relazione che lega il tempo di sgonfiamento e il raggio iniziale della bolla R è del tipo t0 = (2) in cui il parametro è a sua volta legato alla tensione superficiale dell’acqua saponata, alla densità della miscela di gas in uscita dalla bolla e al raggio interno della cannuccia.
Topic: Fluid Mechanics, Conservation of Energy Metodi: Physical Modeling, Energy Conservation Method, Experimental Data Analysis Competenze: Experimental Data Analysis, Graph Linearization, Mathematical Modeling Objects: Bubble, Tube Fonte: Testo (PDF) — p.6 Soluzione: Soluzioni (PDF)
Q.4 [34 p.] By keeping the initial bulb radius R = 3.0 cm fixed and by mediating on at least 8 tests, it measures the time of swelling t as the length L of the straw changes. Use the scissors to set the following L lengths, in addition to the length used to answer the previous questions: 16,0 cm; 13,0 cm; 10,0 cm; 7,0 cm. Before the measures are taken, ensure that the cut edge It is circular in shape. Verifies the compatibility of the measurements obtained with the assumption that the ratio t = f2(L) is type linear. It quantifies the constant parameters that characterize it. The ratio t = f2(L) highlights the effects of viscosity on the flow of fluid into the straw. If there were no energy losses caused by viscosity, all the potential energy initially stored on the surface of the bubble would gradually be transferred to the outgoing air in the form of kinetic energy. This would happen at the limit if the bubble were allowed to deflate through a thin ring (L = 0) of radius. r equal to the inner radius of the straw. The Commission’s proposal for a regulation on the The time of deflation and the initial radius of the bubble R is the type t0 = (2) where the parameter is in turn related to the surface tension of the soap water, the density of the mixture the gas coming out of the bubble and the inner radius of the straw.
Topic: Fluid Mechanics, Conservation of Energy Metodi: Physical Modeling, Energy Conservation Method, Experimental Data Analysis Competenze: Experimental Data Analysis, Graph Linearization, Mathematical Modeling Objects: Bubble, Tube Fonte: Testo (PDF) — p.6 Soluzione: Soluzioni (PDF)
Q.5 [10 p.] Calcola il valore di . È ragionevole ipotizzare che il tipo di relazione t = f2(L) trovata in Q.4 sia valida anche per le bolle di raggio R ̸= 3.0 cm e, in particolare, per i valori di R utilizzati nelle misure di Q.2.
Topic: Fluid Mechanics, Conservation of Energy Metodi: Physical Modeling, Energy Conservation Method, Dimensional Analysis Competenze: Mathematical Modeling, Physical Reasoning, Estimation & Approximation Objects: Bubble, Tube Fonte: Testo (PDF) — p.6 Soluzione: Soluzioni (PDF)
Q.5 [10 p.] Calculate the value of . It is reasonable to assume that the type of relation t = f2(L) found in Q.4 is also valid for beam bubbles R = 3.0 cm and in particular for the R values used in Q.2 measurements.
Topic: Fluid Mechanics, Conservation of Energy Metodi: Physical Modeling, Energy Conservation Method, Dimensional Analysis Competenze: Mathematical Modeling, Physical Reasoning, Estimation & Approximation Objects: Bubble, Tube Fonte: Testo (PDF) — p.6 Soluzione: Soluzioni (PDF)
Q.6 [19 p.] Riporta su uno stesso piano cartesiano gli andamenti delle funzioni t = f2(L) per ciascuno dei valori di raggio R definiti in Q.2.
Topic: Fluid Mechanics Metodi: Experimental Data Analysis, Physical Modeling Competenze: Graph Linearization, Experimental Data Analysis, Mathematical Modeling Objects: Bubble Fonte: Testo (PDF) — p.6 Soluzione: Soluzioni (PDF)
Q.6 [19 p.] Report on the same Cartesian plane the trends of the functions t = f2(L) for each of the values of a radius R defined in Q.2.
Topic: Fluid Mechanics Metodi: Experimental Data Analysis, Physical Modeling Competenze: Graph Linearization, Experimental Data Analysis, Mathematical Modeling Objects: Bubble Fonte: Testo (PDF) — p.6 Soluzione: Soluzioni (PDF)
Q.7 [24 p.] Calcola, per ogni R, la pendenza p delle rette e costruisci il grafico di p = f3(R). Analizzando il grafico Q.7 ti puoi accorgere che la dipendenza p = f3(R) non è semplice. Si vuol indagare come le misure si adattino alla relazione empirica p = k R a (3)
Topic: Fluid Mechanics Metodi: Experimental Data Analysis, Physical Modeling, Curve Fitting Competenze: Graph Linearization, Experimental Data Analysis, Mathematical Modeling Objects: Bubble Fonte: Testo (PDF) — p.6 Soluzione: Soluzioni (PDF)
Q.7 [24 p.] Calculate, for each R, the slope p of the lines and construct the graph of p = f3(R. By looking at the Q.7 chart you can see that the dependence p = f3(R) is not simple. You want to investigate how the measures are adapted to the empirical report; p = k R a (3)
Topic: Fluid Mechanics Metodi: Experimental Data Analysis, Physical Modeling, Curve Fitting Competenze: Graph Linearization, Experimental Data Analysis, Mathematical Modeling Objects: Bubble Fonte: Testo (PDF) — p.6 Soluzione: Soluzioni (PDF)
Q.8 [22 p.] Per verificare se la (3) si adatta alle misure trasformala in una relazione lineare tra le grandezze coinvolte. Costruisci un grafico che ti permetta di ricavare i parametri k e a.
Topic: Fluid Mechanics Metodi: Graph Linearization, Curve Fitting, Experimental Data Analysis Competenze: Graph Linearization, Mathematical Modeling, Experimental Data Analysis Objects: — Fonte: Testo (PDF) — p.6 Soluzione: Soluzioni (PDF)
Q.8 [22 p.] To check whether the (3) is suitable for measurements, transform it into a linear relationship between the quantities involved. Build a graph that lets you get the k and a parameters.
Topic: Fluid Mechanics Metodi: Graph Linearization, Curve Fitting, Experimental Data Analysis Competenze: Graph Linearization, Mathematical Modeling, Experimental Data Analysis Objects: — Fonte: Testo (PDF) — p.6 Soluzione: Soluzioni (PDF)
Q.9 [20 p.] Utilizza le informazioni sin qui ottenute per dedurre la relazione generale t = f(R, L) che fornisce il tempo di sgonfiamento delle bolle di sapone nelle condizioni di lavoro sperimentate. Confronta le previsioni fornite dalla relazione ottenuta con i tempi di sgonfiamento misurati in Q.2 e Q.4. — Pagina 6 di 8 — AIF – Campionati di Fisica 2025 Gara Nazionale – 10 Aprile 2025 – Prova Sperimentale ABACO — — Pagina 7 di 8 — AIF – Campionati di Fisica 2025 Gara Nazionale – 10 Aprile 2025 – Prova Sperimentale — Pagina 8 di 8 —
Topic: Fluid Mechanics, Conservation of Energy Metodi: Physical Modeling, Experimental Data Analysis, Energy Conservation Method Competenze: Mathematical Modeling, Experimental Data Analysis, Physical Reasoning Objects: Bubble, Tube Fonte: Testo (PDF) — p.6 Soluzione: Soluzioni (PDF)
Q.9 [20 p.] Use the information obtained so far to deduce the general ratio t = f(R, L) which provides the time for the soap bubbles to be inflated under the working conditions experienced. Comparison of the forecasts provided by the report obtained with the inflation times measured in Q.2 and Q.4. Page 6 of 8 AIF Physics Championships 2025 National competition 10 April 2025 Experimental test The following table shows the results of the evaluation: — Page 7 of 8 AIF Physics Championships 2025 National competition 10 April 2025 Experimental test Page 8 of 8
Topic: Fluid Mechanics, Conservation of Energy Metodi: Physical Modeling, Experimental Data Analysis, Energy Conservation Method Competenze: Mathematical Modeling, Experimental Data Analysis, Physical Reasoning Objects: Bubble, Tube Fonte: Testo (PDF) — p.6 Soluzione: Soluzioni (PDF)