Prueba experimental: Absorción de luz por un filtro neutro
Cuando un haz de luz de intensidad incide sobre una de las caras planas de un medio parcialmente transparente, como un filtro de gelatina, parte de la luz se transmite y emerge por la otra cara con una intensidad inferior (Fig. 1). La intensidad luminosa se ve reducida en un factor , menor que la unidad, denominado transmitancia:
Cuando el haz de luz atraviesa un conjunto de filtros iguales, la intensidad transmitida es:
La intensidad luminosa transmitida se mide con un fotodetector (LED detector). Supondremos que la diferencia de potencial entre sus terminales es directamente proporcional a dicha intensidad. En consecuencia:
El sistema experimental consta de dos circuitos: el primero está formado por una pila, una resistencia y un LED que actúa como emisor de luz; el segundo lo constituye otro LED que actúa como fotodetector, conectado a un polímetro en función de voltímetro (Fig. 3). Los dos circuitos se acoplan ópticamente mediante un tubo con una ranura transversal donde se colocan los filtros (Fig. 4).
Primer procedimiento para determinar .
Sin ningún filtro en la ranura del tubo () anote el valor indicado por el voltímetro, . Coloque un filtro en la ranura () y tome la medida del voltímetro, . Añada un segundo filtro () y mida , etc., hasta acumular los ocho filtros en la ranura. Presente los datos en una tabla con columnas: N° de filtros , (mV), función de , . (2 p.)
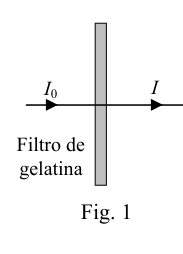 Fig. 1: light beam through gelatin filter
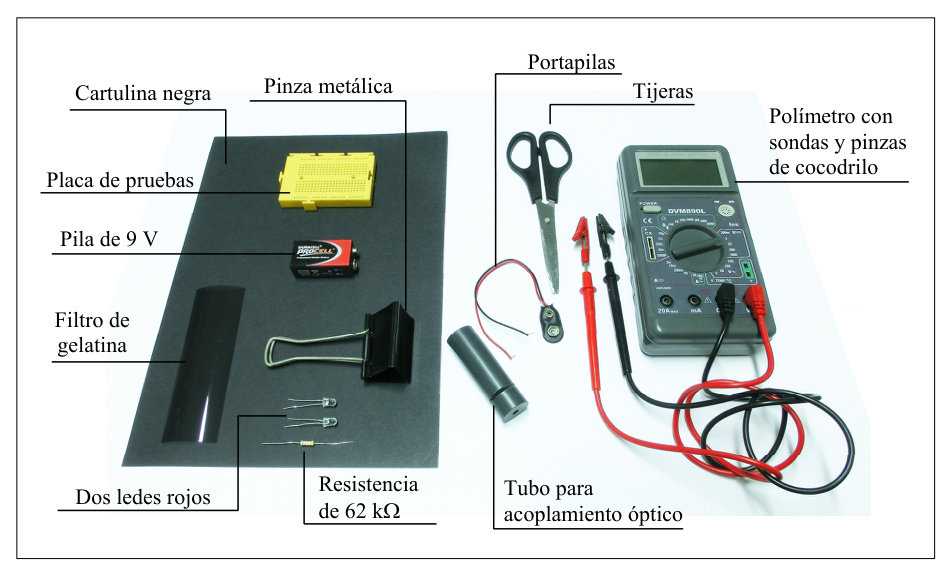 Fig. 2: experimental materials
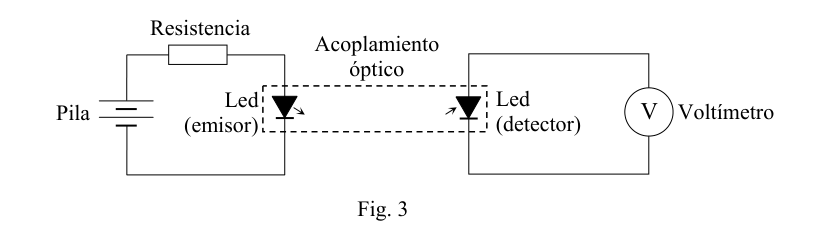 Fig. 3: LED emitter-detector circuit
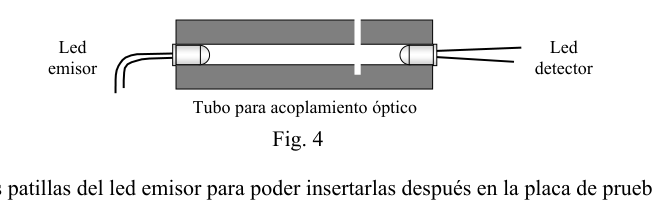 Fig. 4: optical coupling tube
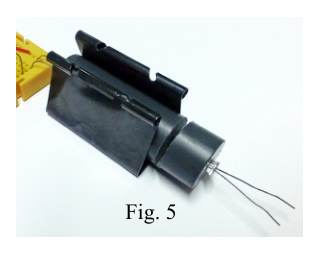 Fig. 5: assembled circuit on breadboard
Topic: Geometric Optics, Circuits Metodi: Experimental Data Analysis, Physical Modeling, Graph Linearization Competenze: Experimental Data Analysis, Measurement & Instrumentation Objects: Battery, Resistor Fonte: Testo (PDF) — p.3
Prova sperimentale: Assorbimento della luce da un filtro neutro
Quando un fascio di luce di intensità incide su una delle facce piane di un mezzo parzialmente trasparente, come un filtro di gelatina, parte della luce viene trasmessa e emerge dall’altra faccia con una intensità inferiore (Fig. 1). L’intensità luminosa è ridotta di un fattore inferiore all’unità, denominato trasmissione:
Quando il fascio di luce passa attraverso un insieme di filtri uguali, l’intensità trasmessa è:
L’intensità luminosa trasmessa è misurata con un fotodettor (LED). Supponiamo che la differenza di potenziale tra i loro terminali sia direttamente proporzionale a tale intensità. Di conseguenza:
Il sistema sperimentale è costituito da due circuiti: il primo è costituito da una pila, una resistenza e un LED che agisce come emettitore di luce; il secondo lo costituisce un altro LED che agisce come fotodettore, collegato a un polimetro in funzione di voltímetro (Fig. 3). I due circuiti sono accoppiati otticamente mediante un tubo con una ranura trasversale dove vengono inseriti i filtri (Fig. 4).
Prima procedura per determinare .
Senza filtri nel tubo () annotate il valore indicato dal voltometro, . Mettete un filtro nella ranura () e prendete la misura del voltometro, . Aggiungi un secondo filtro () e misura , ecc., fino a quando accumuli tutti e otto i filtri nel slot. Presenta i dati in una tabella con colonne: N° di filtri , (mV), funzione , . (2 p.)
Fig. 1: light beam through gelatin filter
Fig. 2: materiali sperimentali
Fig. 3: circuito emittente-detettore LED
Fig. 4 °C: tubo di coppia ottica
Fig. 5: assembled circuit on breadboard
Topic: Geometric Optics, Circuits Metodi: Experimental Data Analysis, Physical Modeling, Graph Linearization Competenze: Experimental Data Analysis, Measurement & Instrumentation Objects: Battery, Resistor Fonte: Testo (PDF) — p.3
Experimental test: Light absorption by a neutral filter
When a beam of light of intensity hits one of the flat surfaces of a partially transparent medium, such as a gelatin filter, some of the light is transmitted and emerges from the other side with a lower intensity (Fig. 1). The luminous intensity is reduced by a factor less than the unit, called transmittance:
When the beam of light passes through a set of identical filters, the transmitted intensity is:
The transmitted light intensity is measured with a photodetector (LED detector). Suppose the potential difference between their terminals is directly proportional to that intensity. Consequently:
The experimental system consists of two circuits: the first is made up of a stack, a resistor and an LED that acts as a light emitting device; the second is another LED that acts as a photodetector, connected to a polymer in the function of voltmeter (Fig. 3). The two circuits are optically coupled by a tube with a transverse groove where the filters are placed (Fig. 4).
Primer procedimiento para determinar .
Without any filter in the tube groove () enter the value indicated by the voltmeter, . Place a filter in the slot () and take the measurement of the voltmeter, . Add a second filter () and measure , etc., until all eight filters are accumulated in the slot. The data is presented in a table with columns: N° of filters , (mV), function of , . (2 p.)
Fig. 1: light beam through gelatin filter
Fig. 2: experimental materials
Fig. 3: LED emitter-detector circuit
Fig. 4: optical coupling tube
Fig. 5: assembled circuit on breadboard
Topic: Geometric Optics, Circuits Metodi: Experimental Data Analysis, Physical Modeling, Graph Linearization Competenze: Experimental Data Analysis, Measurement & Instrumentation Objects: Battery, Resistor Fonte: Testo (PDF) — p.3
Transforme la expresión (3),
para obtener una dependencia lineal entre una función de y . (1 p.)
Topic: Geometric Optics, Order-of-Magnitude Estimation Metodi: Graph Linearization, Experimental Data Analysis, Approximation & Series Expansion Competenze: Mathematical Modeling, Graph Linearization Objects: — Fonte: Testo (PDF) — p.3
Trasforma l’espressione (3),
per ottenere una dipendenza lineare tra una funzione di e . (1 p.)
Topic: Geometric Optics, Order-of-Magnitude Estimation Metodi: Graph Linearization, Experimental Data Analysis, Approximation & Series Expansion Competenze: Mathematical Modeling, Graph Linearization Objects: — Fonte: Testo (PDF) — p.3
Transform the expression (3),
for the purpose of deriving a linear dependence between a function of and . (1 p.)
Topic: Geometric Optics, Order-of-Magnitude Estimation Metodi: Graph Linearization, Experimental Data Analysis, Approximation & Series Expansion Competenze: Mathematical Modeling, Graph Linearization Objects: — Fonte: Testo (PDF) — p.3
Anote en la tercera columna de la tabla anterior los valores de esa función de . (1 p.)
Topic: Geometric Optics, Order-of-Magnitude Estimation Metodi: Experimental Data Analysis, Graph Linearization, Statistical Averaging Competenze: Experimental Data Analysis, Significant Figures Objects: — Fonte: Testo (PDF) — p.3
Nota in terza colonna della tabella precedente i valori di quella funzione di . (1 p.)
Topic: Geometric Optics, Order-of-Magnitude Estimation Metodi: Experimental Data Analysis, Graph Linearization, Statistical Averaging Competenze: Experimental Data Analysis, Significant Figures Objects: — Fonte: Testo (PDF) — p.3
Write down the values of that function in the third column of the table above. (1 p.)
Topic: Geometric Optics, Order-of-Magnitude Estimation Metodi: Experimental Data Analysis, Graph Linearization, Statistical Averaging Competenze: Experimental Data Analysis, Significant Figures Objects: — Fonte: Testo (PDF) — p.3
Represente gráficamente en el papel milimetrado los puntos correspondientes a la dependencia lineal esperada. (3 p.)
Topic: Geometric Optics, Order-of-Magnitude Estimation Metodi: Graph Linearization, Experimental Data Analysis, Curve Fitting Competenze: Graph Linearization, Experimental Data Analysis Objects: — Fonte: Testo (PDF) — p.3
Rappresenta graficamente sul foglio in millimetri i punti corrispondenti alla dipendenza lineare prevista. (3 p.)
Topic: Geometric Optics, Order-of-Magnitude Estimation Metodi: Graph Linearization, Experimental Data Analysis, Curve Fitting Competenze: Graph Linearization, Experimental Data Analysis Objects: — Fonte: Testo (PDF) — p.3
Graphically represent the points corresponding to the expected linear dependence on the millimeter paper. (3 p.)
Topic: Geometric Optics, Order-of-Magnitude Estimation Metodi: Graph Linearization, Experimental Data Analysis, Curve Fitting Competenze: Graph Linearization, Experimental Data Analysis Objects: — Fonte: Testo (PDF) — p.3
Determine la pendiente de la recta que mejor se ajuste a esos puntos. Deduzca el valor de la transmitancia . (4 p.)
Indicación: tomando logaritmos en la ecuación (3) se obtiene
por tanto la pendiente es , y la transmitancia es .
Topic: Geometric Optics, Order-of-Magnitude Estimation Metodi: Graph Linearization, Curve Fitting, Experimental Data Analysis Competenze: Graph Linearization, Experimental Data Analysis Objects: — Fonte: Testo (PDF) — p.3
Determina la pendenza della retta che meglio si adatta a tali punti. Detrazione del valore di trasmissione . (4 p.)
Indicazione: prendendo logaritmi nell’equazione (3) si ottiene
la pendenza è e la trasmissione è .
Topic: Geometric Optics, Order-of-Magnitude Estimation Metodi: Graph Linearization, Curve Fitting, Experimental Data Analysis Competenze: Graph Linearization, Experimental Data Analysis Objects: — Fonte: Testo (PDF) — p.3
Determine the slope of the straight line that best fits those points. Subtract the transmittance value . (4 p.)
Introduction: taking logarithms from equation (3) is obtained
Therefore the slope is , and the transmittance is .
Topic: Geometric Optics, Order-of-Magnitude Estimation Metodi: Graph Linearization, Curve Fitting, Experimental Data Analysis Competenze: Graph Linearization, Experimental Data Analysis Objects: — Fonte: Testo (PDF) — p.3
Haga una estimación de la incertidumbre de . (4 p.)
Indicación: trace las rectas con pendiente máxima y mínima que se ajusten razonablemente a los puntos experimentales y que pasen por el «centro» . Las transmitancias extremas son y , y la incertidumbre es
Topic: Geometric Optics, Order-of-Magnitude Estimation Metodi: Experimental Data Analysis, Error Propagation, Graph Linearization Competenze: Error Propagation, Experimental Data Analysis Objects: — Fonte: Testo (PDF) — p.3
Calcolare l’incertezza di . (4 p.)
Indicazione: traccia le linee a pendice massima e minima che si adattano ragionevolmente ai punti sperimentali e passano attraverso il centro . Le trasmissioni estreme sono e , e l’incertezza è
Topic: Geometric Optics, Order-of-Magnitude Estimation Metodi: Experimental Data Analysis, Error Propagation, Graph Linearization Competenze: Error Propagation, Experimental Data Analysis Objects: — Fonte: Testo (PDF) — p.3
Estimate the uncertainty of . (4 p.)
Instruction: traces the straight lines with maximum slope and minimum slope that reasonably fit the experimental points and pass through the center . The extreme transmittances are and , and the uncertainty is
Topic: Geometric Optics, Order-of-Magnitude Estimation Metodi: Experimental Data Analysis, Error Propagation, Graph Linearization Competenze: Error Propagation, Experimental Data Analysis Objects: — Fonte: Testo (PDF) — p.3
Segundo procedimiento para determinar .
La transmitancia de un filtro también puede determinarse a partir de dos medidas consecutivas con y filtros. Teniendo en cuenta (3), es evidente que
Aplicando (4) a parejas consecutivas de sus nueve medidas , calcule los ocho valores correspondientes de y anótelos en la cuarta columna de la tabla. (1 p.)
Topic: Geometric Optics, Order-of-Magnitude Estimation Metodi: Experimental Data Analysis, Statistical Averaging, Physical Modeling Competenze: Experimental Data Analysis, Significant Figures Objects: — Fonte: Testo (PDF) — p.3
Seconda procedura per determinare .
La trasmissione di un filtro può anche essere determinata da due misure consecutive con filtri e . Considerando (3), è evidente che
Applicando (4) a coppie consecutive delle sue nove misure , calcola gli otto valori corrispondenti di e annotateli nella quarta colonna della tabella. (1 p.)
Topic: Geometric Optics, Order-of-Magnitude Estimation Metodi: Experimental Data Analysis, Statistical Averaging, Physical Modeling Competenze: Experimental Data Analysis, Significant Figures Objects: — Fonte: Testo (PDF) — p.3
Second procedure for determining .
The transmittance of a filter can also be determined from two consecutive measurements with and filters. In view of the above, it is clear that the
Applying (4) to consecutive pairs of its nine measurements , calculate the corresponding eight values of and annotate them in the fourth column of the table. (1 p.)
Topic: Geometric Optics, Order-of-Magnitude Estimation Metodi: Experimental Data Analysis, Statistical Averaging, Physical Modeling Competenze: Experimental Data Analysis, Significant Figures Objects: — Fonte: Testo (PDF) — p.3
Mediante un tratamiento estadístico, calcule el valor más fiable de la transmitancia de un filtro, y su margen de incertidumbre. (4 p.)
Indicación: el valor más fiable es la media de los ocho valores de calculados en el apartado anterior:
La incertidumbre estándar de la media (error típico) es:
Topic: Geometric Optics, Order-of-Magnitude Estimation Metodi: Statistical Averaging, Error Propagation, Experimental Data Analysis Competenze: Error Propagation, Experimental Data Analysis Objects: — Fonte: Testo (PDF) — p.3
Calcolare, mediante un trattamento statistico, il valore più affidabile della trasmissione di un filtro e il suo margine di incertezza. (4 p.)
Indicazione: il valore più affidabile è la media degli otto valori di calcolati nel precedente punto:
L’incertezza standard della media (errore tipico) è:
Topic: Geometric Optics, Order-of-Magnitude Estimation Metodi: Statistical Averaging, Error Propagation, Experimental Data Analysis Competenze: Error Propagation, Experimental Data Analysis Objects: — Fonte: Testo (PDF) — p.3
By statistical treatment, calculate the most reliable value of a filter’s transmittance and its margin of uncertainty. (4 p.)
Introduction: the most reliable value is the average of the eight values calculated in the previous paragraph:
The standard uncertainty of the mean (typical error) is:
Topic: Geometric Optics, Order-of-Magnitude Estimation Metodi: Statistical Averaging, Error Propagation, Experimental Data Analysis Competenze: Error Propagation, Experimental Data Analysis Objects: — Fonte: Testo (PDF) — p.3