Contexto experimental: Se desea determinar el índice de refracción de una lámina portaobjetos de vidrio. El dispositivo experimental consta de un led amarillo emisor y un led amarillo fotodetector acoplados ópticamente mediante un tubo con una ranura transversal donde se coloca la lámina. La diferencia de potencial (sin lámina) y (con lámina) medidas por el voltímetro son directamente proporcionales a las intensidades luminosas incidente y transmitida, respectivamente. De la teoría se tiene:
donde es la transmitancia de cada interfase vidrio-aire, dada por:
con el índice de refracción del aire.
Conecte el portapilas, encienda el polímetro y, utilizando el destornillador, inicie las medidas moviendo el tornillo del potenciómetro hasta que el voltímetro señale un primer valor superior a 0 V. Anote el valor exacto obtenido (primera medida de ). A continuación, coloque la lámina portaobjetos en la ranura del tubo y anote la medida señalada por el voltímetro. Actuando sobre el tornillo del potenciómetro, continúe tomando medidas hasta recoger al menos quince pares de valores de y , en un intervalo para comprendido entre 0 mV y 1000 mV. Presente los datos en una tabla:
| / mV | / mV |
|---|---|
(4 puntos)
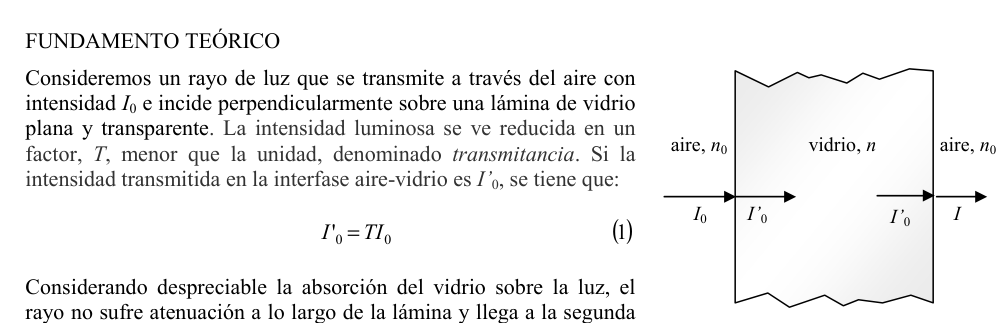 Fig. 1: rayo de luz a través de lámina
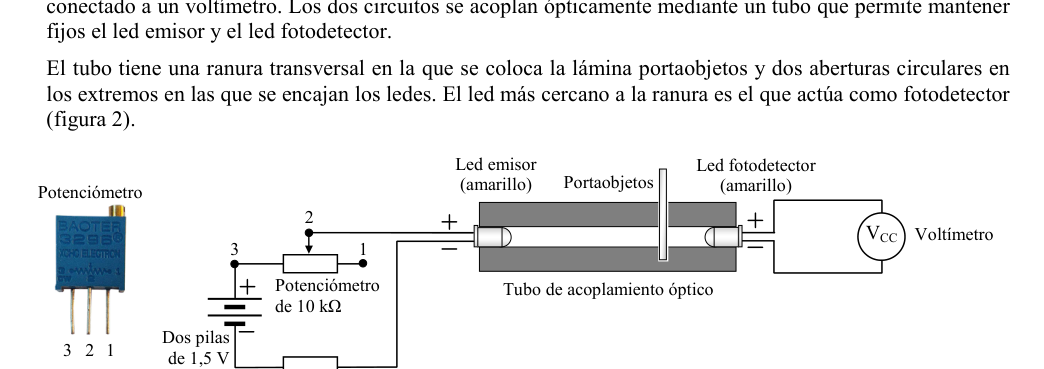 Fig. 2: circuito emisor-fotodetector con tubo
Topic: Geometric Optics, Electrostatics Metodi: Experimental Data Analysis, Snell’s Law, Physical Modeling Competenze: Measurement & Instrumentation, Experimental Data Analysis Objects: — Fonte: Testo (PDF) — p.4
Context sperimentale: Si desidera determinare l’indice di refraczione di una lamina portante di oggetti di vetro. Il dispositivo sperimentale consiste in un LED giallo emittente e un LED giallo fotodettoriale accoppiati otticamente attraverso un tubo con una ranetta trasversale dove viene collocata la lamina. La differenza di potenziale (senza lamina) e (con lamina) misurata dal voltímetro è direttamente proporzionale alle intensità luminose incidente e trasmessa, rispettivamente. La teoria dice:
dove è la trasmissione di ogni interfaccia vetro-aria, data da:
con l’indice di refraczione dell’aria.
Collegare il portafogli, accendere il polimetro e, utilizzando il tornitore, avviare le misure spostando lo scheggio del potenziometro fino a quando il voltimetro non indica un primo valore superiore a 0 V. Nota il valore esatto ottenuto (prima misura di ). Poi inserire la lamina portatile nella rottura del tubo e annotare la misura indicata dal voltmeter. Agendo sul pulsante del potenziometro, continua a misurare fino a raccogliere almeno 15 paia di valori **** di e , in un intervallo di compresa tra 0 mV e 1000 mV. Presenta i dati in una tabella:
| / mV | / mV |
|---|---|
(4 punti)
Fig. 1: raggio di luce attraverso la lamina
Fig. 2: circuito di emissione-fotodettoria con tubo
Topic: Geometric Optics, Electrostatics Metodi: Experimental Data Analysis, Snell’s Law, Physical Modeling Competenze: Measurement & Instrumentation, Experimental Data Analysis Objects: — Fonte: Testo (PDF) — p.4
Experimental context: The refractive index of a sheet of glass bearing objects is to be determined. The experimental device consists of a yellow LED emitter and a yellow LED photodetector optically coupled by a tube with a transverse groove where the sheet is placed. The potential difference (without sheet) and (with sheet) measured by the voltmeter are directly proportional to the incident and transmitted luminous intensities, respectively. The theory is:
where is the transmission of each glass-air interface, given by:
with the air refractive index.
Connect the power-driven control, turn on the polymer and, using the screwdriver, start measurements by moving the power-driven control until the voltmeter indicates a first value greater than 0 V. Write down the exact value obtained (first measurement of ). Then place the carrier sheet in the tube slot and write down the measurement indicated by the voltmeter. Continue measuring the power meter screw until you collect at least fifteen **** value pairs of and , at an interval for between 0 mV and 1000 mV. Present the data in a table:
| / mV | / mV |
|---|---|
(four points)
The Commission shall adopt implementing acts in accordance with Article 21 of Regulation (EC) No 1272/2009. 1: light beam through sheet*
The Commission shall adopt implementing acts in accordance with Article 21 of Regulation (EC) No 1272/2009. 2: tube-based photodetector-emitting circuit*
Topic: Geometric Optics, Electrostatics Metodi: Experimental Data Analysis, Snell’s Law, Physical Modeling Competenze: Measurement & Instrumentation, Experimental Data Analysis Objects: — Fonte: Testo (PDF) — p.4
Escriba la expresión (4)
de forma que aparezca explícitamente una dependencia lineal entre y . Represente gráficamente los puntos correspondientes a esa dependencia, con en el eje de abscisas, y trace la línea que mejor se ajusta.
(4 puntos)
Topic: Geometric Optics Metodi: Graph Linearization, Experimental Data Analysis, Physical Modeling Competenze: Graph Linearization, Mathematical Modeling Objects: — Fonte: Testo (PDF) — p.4
Scrivi l’espressione (4)
in modo da rendere esplicitamente apparente una dipendenza lineare tra e . Rappresenta graficamente i punti corrispondenti a tale dipendenza, con sull’asse delle abcissioni, e traccia la linea che si adatta meglio.
(4 punti)
Topic: Geometric Optics Metodi: Graph Linearization, Experimental Data Analysis, Physical Modeling Competenze: Graph Linearization, Mathematical Modeling Objects: — Fonte: Testo (PDF) — p.4
Write the expression (4)
so that a linear **dependence ** is explicitly displayed between and . Graphically represent the points corresponding to that dependence, with on the axis of the abscises, and draw the line that fits best.
(four points)
Topic: Geometric Optics Metodi: Graph Linearization, Experimental Data Analysis, Physical Modeling Competenze: Graph Linearization, Mathematical Modeling Objects: — Fonte: Testo (PDF) — p.4
Halle la pendiente de la línea obtenida en el apartado anterior y deduzca el valor de .
(2 puntos)
Topic: Geometric Optics Metodi: Graph Linearization, Experimental Data Analysis Competenze: Graph Linearization, Mathematical Modeling Objects: — Fonte: Testo (PDF) — p.4
Trova la pendenza della linea ottenuta nel paragrafo precedente e deduci il valore di .
(2 punti)
Topic: Geometric Optics Metodi: Graph Linearization, Experimental Data Analysis Competenze: Graph Linearization, Mathematical Modeling Objects: — Fonte: Testo (PDF) — p.4
Find the slope of the line obtained in the previous section and deduce the value of .
(two points)
Topic: Geometric Optics Metodi: Graph Linearization, Experimental Data Analysis Competenze: Graph Linearization, Mathematical Modeling Objects: — Fonte: Testo (PDF) — p.4
Considerando únicamente las barras de error de los puntos extremos de la gráfica (ver ANEXO 2), halle las rectas de máxima y mínima pendiente y los valores de esas pendientes.
Para establecer la longitud de las barras de error de esos dos puntos se han de tener en cuenta las características del multímetro dadas por el fabricante. Este indica que, en medidas de voltaje para corriente continua en el rango de 2 V:
- Resolución: 1 mV
- Precisión: de la medida dígito
Ejemplo: para mV: por lo que mV.
(3 puntos)
Topic: Geometric Optics Metodi: Error Propagation, Experimental Data Analysis, Graph Linearization Competenze: Error Propagation, Experimental Data Analysis Objects: — Fonte: Testo (PDF) — p.4
Considerando solo le barre di errore dei punti estremisti **** del grafico (vedere ANNEXO 2), trova le linee di pendice massima e minima e i valori di tali pendici.
Per stabilire la lunghezza delle barre di errore di tali due punti, si devono tenere conto delle caratteristiche del multimetro indicate dal fabbricante. Questo indica che, per misure di tensione a corrente continua nel range di 2 V:
- Risoluzione: 1 mV
- Precisione: della misura digito
Esempio: per mV: per cui mV.
(3 punti)
Topic: Geometric Optics Metodi: Error Propagation, Experimental Data Analysis, Graph Linearization Competenze: Error Propagation, Experimental Data Analysis Objects: — Fonte: Testo (PDF) — p.4
Considering only the error bars of the **extreme points ** of the graph (see ANNEX 2), find the slope-maximum and slope-minimum straight lines and the values of those slopes.
The length of the error bars at those two points shall be determined by taking into account the characteristics of the multimeter given by the manufacturer. This indicates that, in measurements of DC voltage in the range of 2 V:
- Resolution: 1 mV
- Accuracy: of the measurement digit
Ejemplo: para mV: por lo que mV.
(three points)
Topic: Geometric Optics Metodi: Error Propagation, Experimental Data Analysis, Graph Linearization Competenze: Error Propagation, Experimental Data Analysis Objects: — Fonte: Testo (PDF) — p.4
A partir de las pendientes máxima y mínima obtenidas en el apartado anterior, calcule la incertidumbre .
(1 punto)
Topic: Geometric Optics Metodi: Error Propagation, Experimental Data Analysis Competenze: Error Propagation, Mathematical Modeling Objects: — Fonte: Testo (PDF) — p.4
Sulla base delle pendenti massime e minime ottenute nel paragrafo precedente, calcolare l’incertezza .
(punto 1)
Topic: Geometric Optics Metodi: Error Propagation, Experimental Data Analysis Competenze: Error Propagation, Mathematical Modeling Objects: — Fonte: Testo (PDF) — p.4
From the maximum and minimum slopes obtained in the previous paragraph, calculate the uncertainty .
(a) the number of days
Topic: Geometric Optics Metodi: Error Propagation, Experimental Data Analysis Competenze: Error Propagation, Mathematical Modeling Objects: — Fonte: Testo (PDF) — p.4
Determine la transmitancia y su incertidumbre .
Indicación: si tiene incertidumbre , entonces y
(2 puntos)
Topic: Geometric Optics Metodi: Error Propagation, Experimental Data Analysis Competenze: Error Propagation, Mathematical Modeling Objects: — Fonte: Testo (PDF) — p.4
Determina la trasmissione e la sua incertezza .
*Indicazione: * se ha un’incertezza , allora e
(2 punti)
Topic: Geometric Optics Metodi: Error Propagation, Experimental Data Analysis Competenze: Error Propagation, Mathematical Modeling Objects: — Fonte: Testo (PDF) — p.4
Determine the transmission and its uncertainty .
Introduction: if is uncertain then and
(two points)
Topic: Geometric Optics Metodi: Error Propagation, Experimental Data Analysis Competenze: Error Propagation, Mathematical Modeling Objects: — Fonte: Testo (PDF) — p.4
A partir de la expresión
halle el valor del índice de refracción , considerando que .
(2 puntos)
Topic: Geometric Optics Metodi: Snell’s Law, Physical Modeling, Experimental Data Analysis Competenze: Mathematical Modeling, Physical Reasoning Objects: — Fonte: Testo (PDF) — p.4
Dall’espressione
si trova il valore dell’indice di rifrazione , considerando che .
(2 punti)
Topic: Geometric Optics Metodi: Snell’s Law, Physical Modeling, Experimental Data Analysis Competenze: Mathematical Modeling, Physical Reasoning Objects: — Fonte: Testo (PDF) — p.4
From the expression
Find the value of the refractive index , taking into account that .
(two points)
Topic: Geometric Optics Metodi: Snell’s Law, Physical Modeling, Experimental Data Analysis Competenze: Mathematical Modeling, Physical Reasoning Objects: — Fonte: Testo (PDF) — p.4
Determine el valor de la incertidumbre del índice de refracción, .
(2 puntos)
Topic: Geometric Optics Metodi: Error Propagation, Experimental Data Analysis Competenze: Error Propagation, Mathematical Modeling Objects: — Fonte: Testo (PDF) — p.4
Determina il valore dell’incertezza dell’indice di refraczione, .
(2 punti)
Topic: Geometric Optics Metodi: Error Propagation, Experimental Data Analysis Competenze: Error Propagation, Mathematical Modeling Objects: — Fonte: Testo (PDF) — p.4
Determine the uncertainty value of the refractive index, .
(two points)
Topic: Geometric Optics Metodi: Error Propagation, Experimental Data Analysis Competenze: Error Propagation, Mathematical Modeling Objects: — Fonte: Testo (PDF) — p.4