UN CD ROM COME SPETTROMETRO Solo per questo esperimento NON sei tenuto ad indicare le incertezze nelle tue misure Lo scopo di questo esperimento è di arrivare a tracciare un grafico della conduttanza*di un fotoresistore (LDR: Light Dependent Resistance, la cui resistenza varia quando è illuminato) in funzione della lunghezza d’onda su tutto lo spettro visibile.
- la conduttanza G è il reciproco della resistenza e si misura in siemens (S): 1 S = 1 -1. Questo esperimento consiste di cinque fasi:
Produrre lo spettro della luce di una lampadina a filamento di tungsteno (12 V, 50 W- identificata con la lettera “A”) usando come reticolo a riflessione una striscetta incurvata (concava) ricavata da un CD ROM.
Operando una scansione dello spettro del primo ordine, ben focalizzato, misurare la conduttanza del fotoresistore per un numero adeguato di lunghezze d’onda. Riportare in un grafico le misure eseguite, in funzione della lunghezza d’onda.
Mostrare che il filamento della lampadina “A” si comporta approssimativamente come un corpo nero ideale.
Trovare la temperatura del filamento della lampadina “A” quando questa è alimentata a 12 V.
Tenere conto del fatto che l’energia nello spettro di emissione della lampadina “A” non è distribuita uniformemente e correggere di conseguenza il grafico della conduttanza in funzione della lunghezza d’onda. Precauzioni
Fare attenzione a non scottarsi.
La lampadina individuata dalla lettera “B” non deve essere in nessun caso alimentata ad una tensione superiore a 2.0 V.
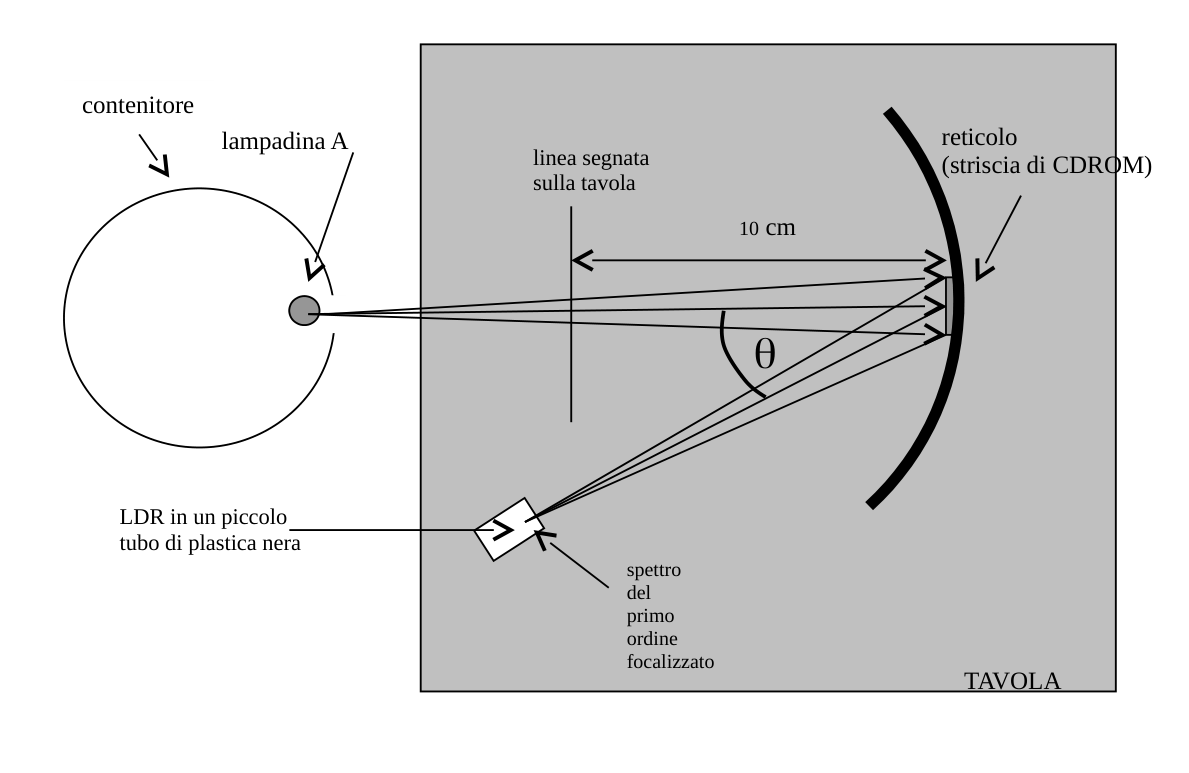
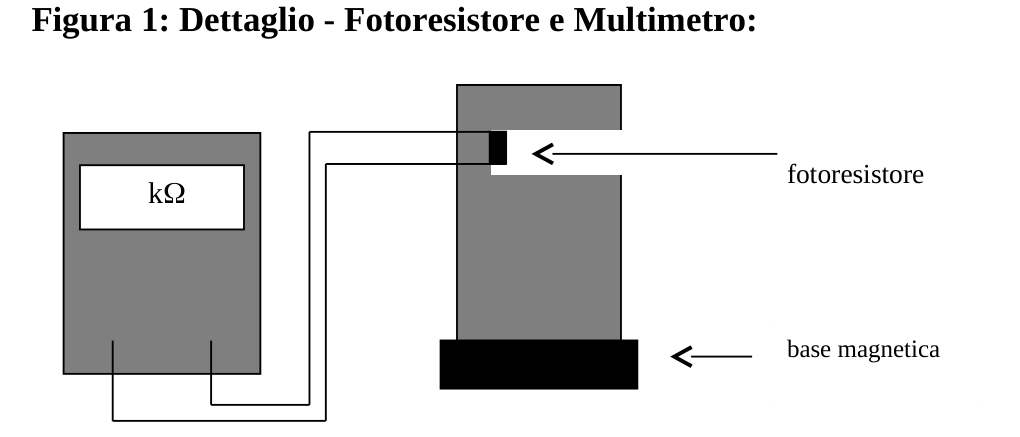
Il multimetro nella sua funzione di ohmetro non deve essere collegato a circuiti alimentati. Procedimento (a) L’apparato (mostrato in figura 1) è stato sistemato in modo che la luce della lampadina incida perpendicolarmente sul reticolo incurvato e il fotoresistore sia posto in corrispondenza allo spettro di primo ordine, ben focalizzato. Spostare il fotoresistore lungo lo spettro di primo ordine per osservare come la sua resistenza (misurata con il multimetro “X”) cambia con la posizione.
(b) (i) Prendere le misure della resistenza R del fotoresistore in diverse posizioni lungo lo spettro di primo ordine e riportarle nella tabella che vi è stata data. (ii) Costruire un grafico della conduttanza G in funzione della lunghezza d’onda riportandolo sulla carta millimetrata che avete a disposizione. Nota L’angolo fra i raggi incidente (luce bianca) e quello riflesso dal reticolo (a lunghezza d’onda ) nello spettro di primo ordine (vedi Figura 1) è dato da: sen = /d dove d è la separazione fra le righe del reticolo. Il reticolo ha 620 linee per millimetro. Il grafico ottenuto in (b)(ii) non riflette correttamente la sensibilità del fotoresistore alle diverse lunghezze d’onda in quanto non si è tenuto conto delle caratteristiche di emissione della lampadina “A”. Queste caratteristiche saranno studiate nelle parti (c) e (d) consentendo di tracciare (parte e) una curva di sensibilità più corretta.
Osservare che, nella parte (c), tre multimetri sono collegati con funzione di amperometri; questi NON devono essere regolati né spostati. Usare quindi solo il quarto multimetro (individuato dalla lettera “X”) per tutte le misure di tensione. (c) Se la lampadina a 50 W emette come un corpo nero si può mostrare che fra la differenza di potenziale V applicata al filamento e la corrente I che lo attraversa vale la relazione: V3 = CI5 dove C è una costante. Misurare coppie di valori corrispondenti di V e di I per la lampadina “A” (nel contenitore). L’amperometro è già collegato e non deve essere toccato. (i) Registrare nella tabella riportata sul foglio risposte i dati ed i valori di tutte le grandezze calcolate. (ii) Tracciare sulla carta millimetrata che è stata fornita un grafico opportuno per mostrare che il filamento emette come un corpo nero. (d) Per apportare le correzioni al grafico costruito in (b)(ii) occore conoscere la temperatura di lavoro del filamento della lampadina “A” Ciò si può fare conoscendo come varia la resistenza con la temperatura.
È stato fornito un grafico che rappresenta la variazione della resistività del tungsteno (misurata in cm) in funzione della temperatura (misurata in Kelvin).
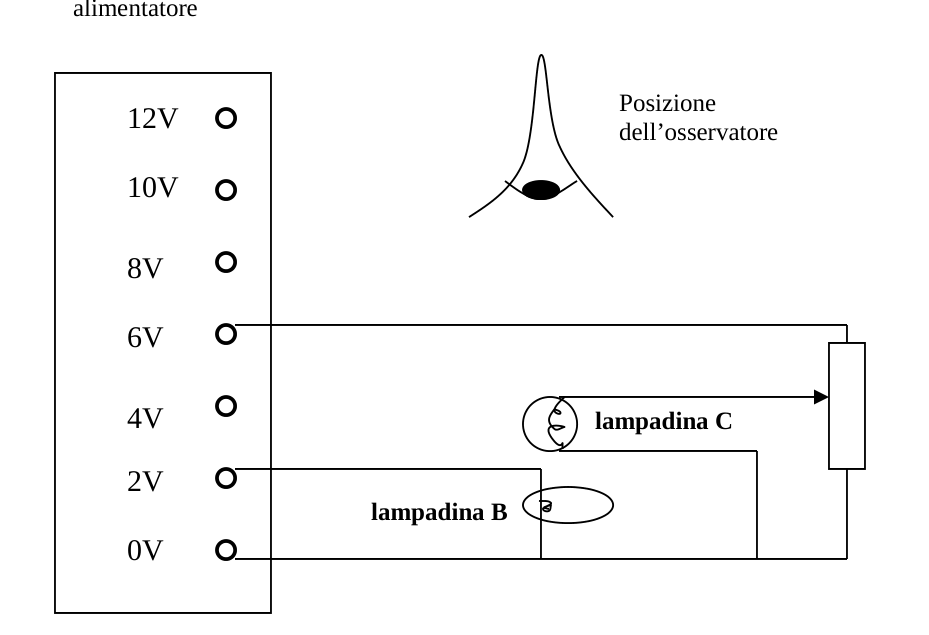
Se si riesce a misurare la resistenza del filamento della lampadina “A” ad una data temperatura, allora si può determinare la sua temperatura misurando la resistenza quando viene alimentata a 12 V. Purtroppo la resistenza di questo filamento a temperatura ambiente è troppo bassa per essere misurata con sufficiente precisione con questa apparecchiatura. Per questo è messa a disposizione una seconda lampadina, più piccola, denominata con “C”: questa presenta, a temperatura ambiente, una resistenza maggiore e misurabile. La lampadina “C” può essere usata come elemento di supporto nella procedura descritta qui sotto. È messa a disposizione anche un’altra lampadina a 12 V e 50 W (denominata con “B”) e identica alla lampadina “A”. Le lampadine “B” e “C” sono montate sulla basetta e collegate nella maniera mostrata in Figura 2. (i) Misurare la resistenza della lampdina “C” quando è spenta e si trova a temperatura ambiente. (Usare il multimetro “X” e assumere che la temparatura ambiente sia di 300 K) Riportare il valore di questa resistenza, indicata con RC1, sul foglio delle risposte. (ii) Utilizzare il circuito mostrato in Figura 2 per confrontare le temperature dei filamenti delle lampadine “B” e “C”. Se il filamento piccolo è più freddo di quello grande, osservandolo allineato con l’altro, è visibile come una sottile traccia scura. Usando il resistore a resistenza variabile si può variare la corrente della lampadina “C” fino a quando, osservando i filamenti sovrapposti si può dedurre che hanno la stessa temperatura. Una volta raggiunte queste condizioni misurare le resistenze delle lampadine “B” e “C” e riportare i valori di RC2 and RB sul foglio risposte. Ricordare che gli amperometri sono già collegati. (iii) Usare il grafico della resistività in funzione della temperatura (che vi è stato fornito) per dedurne la temperatura comune dei filamenti delle lampadine “B” e “C”. Riportare questa temperatura, T2V, sul foglio delle risposte. (iv) Misurare la resistenza del filamento della lampadina “A” – nel contenitore – quando è collegata all’alimentatore a 12 V. Ancora una volta notare che l’amperometro è già collegato e non deve essere toccato. Riportare questo valore, R12V, sul foglio delle risposte. (v) Usare i valori della resistenza della lampadina “A” quando è alimentata a 2 V e a 12 V e la sua temperatura misurata a 2 V per ricavare la sua temparatura quando è alimentata a 12 V. Riportare questo valore della temperatura, T12V, nella tabella sul foglio risposte.
Avete ricevuto dei grafici che danno l’intensità relativa della radiazione di corpo nero (curve di Plank) alle temperature di: 2000 K, 2250 K, 2500 K, 2750 K, 3000 K, 3250 K.
(e) Usare questi grafici ed il risultato ottenuto al punto (d)(v) per tracciare un grafico corretto della conduttanza del fotoresistore (in unità arbitrarie) in funzione della lunghezza d’onda usando la carta millimetrata che vi è stata consegnata. Assumere che la conduttanza del fotoresistore ad ogni lunghezza d’onda sia direttamente proporzionale all’intensità della radiazione a quella lunghezza d’onda. (Questa assunzione è ragionevole alle basse intensità della luce che incide sul fotoresistore in questo esperimento). Assumere che l’effetto di diffrazione del reticolo sia uguale in ogni parte dello spettro del primo ordine. .
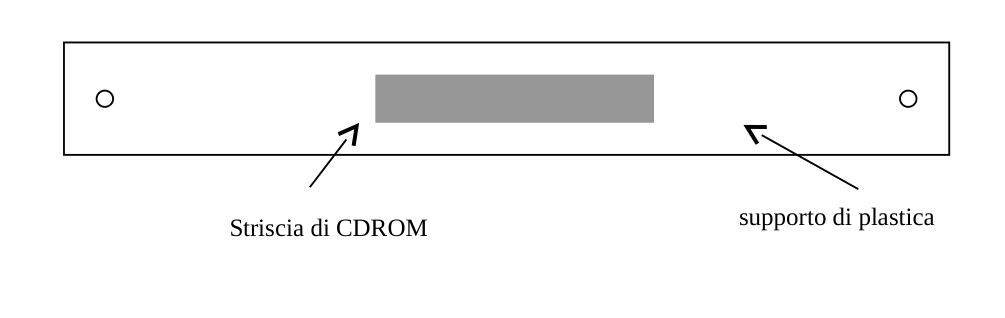
Figura 1 – Apparato sperimentale per (a) Figura 1: Dettaglio – il reticolo: Figura 1: Dettaglio - Fotoresistore e Multimetro: k base magnetica fotoresistore reticolo (striscia di CDROM) contenitore lampadina A LDR in un piccolo tubo di plastica nera
spettro del primo ordine focalizzato TAVOLA 10 cm linea segnata sulla tavola Striscia di CDROM supporto di plastica
Figura 2 Si noti che questo disegno non riporta i multimetri 12V 10V 8V 6V 4V 2V 0V lampadina B lampadina C alimen
p.5 — Apparato sperimentale con lampadina e reticolo
p.5 — Dettaglio del reticolo con striscia CDROM
p.5 — Dettaglio fotoresistore e multimetro
p.6 — Schema alimentatore con lampadine B e C
Topic: Wave Optics, Thermodynamics, Circuits Metodi: Interference & Diffraction Analysis, Experimental Data Analysis, Graph Linearization Competenze: Experimental Data Analysis, Graph Linearization, Measurement & Instrumentation Objects: Diffraction Grating Fonte: Testo (PDF) — p.1
A CD ROM like a spectrometer Only for this experiment you are not required to indicate the Uncertainties in your measurements The purpose of this experiment is to get to a graph of the behavior of a light-dependent resistor (LDR), the resistance of which varies when The lighting is the lighting of the light source (in the light source) in relation to the wavelength across the entire visible spectrum.
- the conductivity G is the reciprocal of the resistance and is measured in siemens (S): 1 S = 1 -1. This experiment consists of five stages:
Producing the light spectrum of a tungsten filament lamp (12 V, 50 W- identified by the letter A) using a strip as a reflective mesh curved (concave) derived from a CD ROM.
By performing a first order, well-focused spectrum scan, measuring the The photoresistors shall be conductive for an appropriate number of wavelengths. Reporting In a graph the measurements performed, depending on the wavelength.
Show that the filament of the lamp A behaves approximately It’s like an ideal black body.
Find the temperature of the filament of the lamp A when this is Powered by 12 V.
Take into account that the energy in the emission spectrum of the lamp A The graph of the The resulting wave length is a function of the conductivity. Precautions
Be careful not to get burned.
The lamp identified by the letter B shall not be in any case Powered by a voltage greater than 2,0 V.
The multimeter in its function of ohm shall not be connected to circuits powered. The procedure (a) The apparatus (shown in Figure 1) has been arranged so that the light of the The lamp shall be perpendicular to the curved lattice and the photoresistors shall be It’s a very well-focused, first-order spectrum. Moving the The first order photoresistors along the spectrum to observe how its The resistance (measured with the multimeter X) changes with position.
(b) (i) Measuring the resistance R of the photoresistors in different position along the first order spectrum and return them to the table below It was given. (ii) Build a diagram of the conductivity G according to the length The paper is then printed on the millimeter paper you have at your disposal. Note to the press The angle between the incident rays (white light) and the angle reflected by the reticle (wavelength) in the first order spectrum (see Figure 1) is given by: The following table shows the following: where d is the separation between the lines of the lattice. The lattice has 620 lines per millimeter. The graph obtained in (b) (ii) does not correctly reflect the sensitivity of the photoresistors to The characteristics of the waveforms are not taken into account. the emission of the lamp A. These characteristics will be discussed in Parts (c) and (d) allowing a more correct sensitivity curve to be drawn (part e).
Note that in Part (c) three multimeters are connected by a function of Amp; these do NOT have to be adjusted or moved. Use only the a fourth multimeter (indicated by the letter X) for all voltage measurements. (c) If the 50 W bulb emits as a black body you can show that between the difference of potential V applied to the filament and current I passing through it the report shall be: V3 = CI5 where C is a constant. Measure pairs of V and I values for the bulb A (in container). The amperometer is already connected and must not be touched. (i) Record the data and values of all the data in the table on the reply sheet the calculated quantities. (ii) Draw on millimeter paper that an appropriate chart has been provided To show that the filament emits like a black body. (d) To make corrections to the graph constructed in (b) (ii) you need to know the The working temperature of the filament lamp A This can be done Knowing how resistance varies with temperature.
A graph showing the variation in the resistivity of the tungsten (measured in cm) according to temperature (measured in
- Kelvin . - What ?
If the resistance of the filament of the lamp A can be measured at a given date temperature, then you can determine its temperature by measuring the resistance when It is powered by 12 V. Unfortunately, the resistance of this filament to temperature The environment is too low to be measured with enough accuracy with this The equipment. This is why a second, smaller light bulb is made available. denominated in C: this has a higher resistance at room temperature and measurable. The lamp C can be used as a support element in the The procedure described below. Another 12 V light bulb is also available and 50 W (denoted with B) and identical to the bulb A. The bulbs B and C are mounted on the base and connected as shown in Figure 2. (i) Measure the resistance of the lamp when it is off and located at the ambient temperature. (Use the multimeter X and assume that the (T) The value of this resistance, indicated by RC1, on the reply sheet. (ii) Use the circuit shown in Figure 2 to compare temperatures the filament of the bulbs B and C. If the small filament is more The cold of the great, when observing it aligned with the other, is visible as A thin, dark trail. Using the variable resistor you can The light bulb is then switched on to the current. The overlapping filaments can be inferred to have the same temperature. One of them. Once these conditions are met, measure the resistance of the lamps. B and C and return the values of RC2 and RB on the reply sheet. Remembering The ampere meters are already connected. (iii) The following: Using the resistivity graph according to the temperature (which is The average temperature of the filaments of the Lamps B and C. Report this temperature, T2V, to the sheet of The answer is: (iv) Measure the resistance of the filament of the lamp A in the container when connected to the 12 V power supply. Once again, note that The amperometer is already connected and must not be touched. Bring this back R12V on the answer sheet. (v) Use the resistance values of the lamp A when powered to 2 V and 12 V and its temperature measured at 2 V to obtain its Tempering when powered to 12 V. The value of the temperature, T12V, in the table on the answer sheet.
You’ve received graphs that give the relative intensity of body radiation. black (Plank curve) at temperatures of: 2000 K, 2250 K, 2500 K, 2750 K, 3000 K, 3250 K.
(e) Use these graphs and the result obtained in (d) (v) to draw a graph The correctness of the photoresistor conductance (in arbitrary units) according to the The length of the wave using the millimeter paper that was delivered to you. Assume that the photoresistor conductivity at any wavelength is directly proportional to the radiation intensity at that length I’m going to go. (This assumption is reasonable at low light intensities that affect the The photoresistors in this experiment. Assume that the diffraction effect of the the lattice is the same in each part of the spectrum of the first order. .
Figure 1 Experimental apparatus for (a) Figure 1: Detail the grid: Figure 1: Detail - Photoresistors and multimeters: k Magnetic base Other, of a kind used for the manufacture of goods Other, of a kind used for the manufacture of goods (CDROM tape) container Lamp A LDR in a small Other, of a width of not more than 15 mm
Spectrum of the first Order Focused Table 10 cm the line marked On the table The following table shows the information: Plastic support
Figure 2 Note that this drawing does not show the multimeter 12V 10V 8V 6V 4V 2V 0V Lamp B Lamp C food
Experimental apparatus with lamp and lathe
The following information is provided for in the Annex to Implementing Regulation (EU) No 1308/2013:
**p.5 ** Detailed photoresistors and multimeters
**p.6 ** Power supply scheme with B and C lamps
Topic: Wave Optics, Thermodynamics, Circuits Metodi: Interference & Diffraction Analysis, Experimental Data Analysis, Graph Linearization Competenze: Experimental Data Analysis, Graph Linearization, Measurement & Instrumentation Objects: Diffraction Grating Fonte: Testo (PDF) — p.1