Un CD ROM come spettrometro
Lo scopo di questo esperimento è tracciare un grafico della conduttanza di un fotoresistore (LDR: Light Dependent Resistance) in funzione della lunghezza d’onda su tutto lo spettro visibile.
La conduttanza è il reciproco della resistenza: , misurata in siemens ().
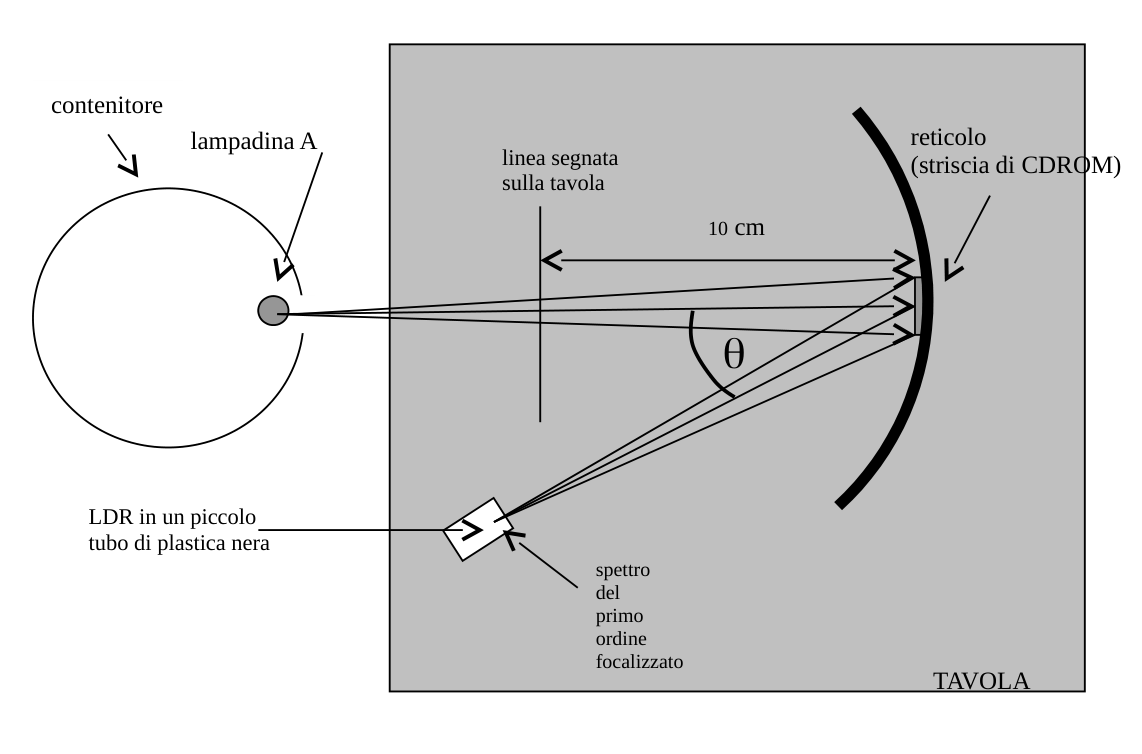
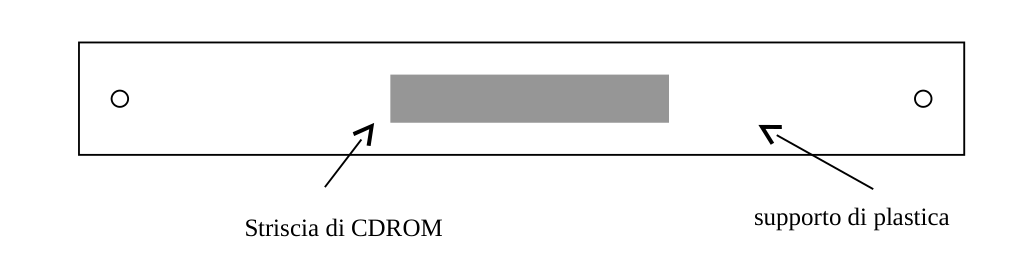
Come reticolo a riflessione si utilizza una striscetta concava ricavata da un CD ROM con (620 linee per millimetro). La sorgente è una lampadina a filamento di tungsteno (12 V, 50 W, denominata “A”).
L’angolo tra il raggio incidente e il raggio riflesso nello spettro di primo ordine è dato da:
L’esperimento si articola in cinque fasi:
Fase (a) — Osservazione qualitativa dello spettro
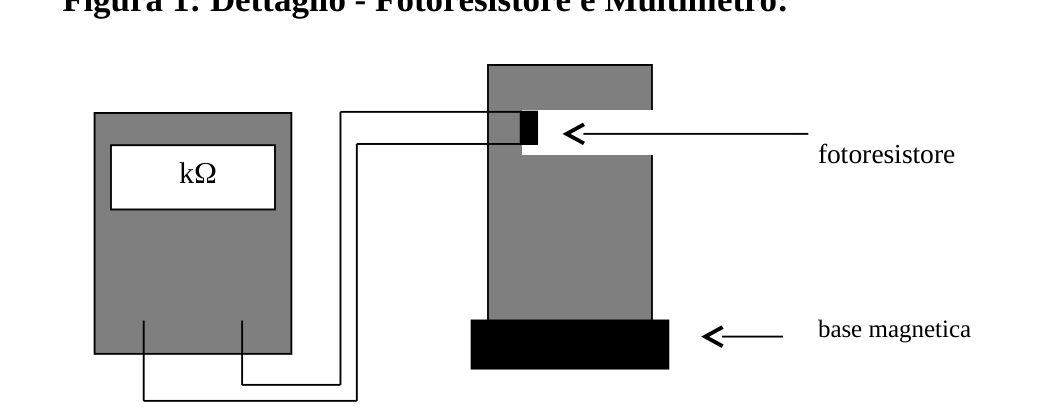
L’apparato è predisposto in modo che la luce della lampadina colpisca perpendicolarmente il reticolo e il fotoresistore sia posizionato in corrispondenza dello spettro di primo ordine, ben focalizzato. Spostare il fotoresistore lungo lo spettro di primo ordine e osservare come la sua resistenza , misurata con il multimetro “X”, cambia con la posizione.
Fase (b) — Misura di
(i) Misurare la resistenza del fotoresistore in diverse posizioni lungo lo spettro di primo ordine e riportare i valori nella tabella fornita.
(ii) Costruire un grafico della conduttanza
in funzione della lunghezza d’onda su carta millimetrata.
Nota: il grafico ottenuto non riflette correttamente la sensibilità spettrale del fotoresistore perché non tiene conto delle caratteristiche di emissione della lampadina “A”. Queste saranno studiate nelle fasi (c) e (d).
Fase (c) — Verifica del comportamento da corpo nero
Se la lampadina da 50 W emette come un corpo nero, si può dimostrare che tra la differenza di potenziale applicata al filamento e la corrente che lo attraversa vale la relazione:
dove è una costante.
(i) Misurare coppie di valori corrispondenti di e per la lampadina “A” (l’amperometro è già collegato e non deve essere toccato). Registrare i dati e tutte le grandezze calcolate nella tabella sul foglio risposte.
(ii) Tracciare su carta millimetrata un grafico opportuno per mostrare che il filamento si comporta approssimativamente come un corpo nero ideale.
Fase (d) — Determinazione della temperatura del filamento
Per correggere il grafico di fase (b) occorre conoscere la temperatura di lavoro del filamento della lampadina “A” quando è alimentata a 12 V. Si dispone del grafico della resistività del tungsteno (in ) in funzione della temperatura (in K) e di una seconda lampadina ausiliare “C” (più piccola, con resistenza misurabile a temperatura ambiente) e di una lampadina “B” identica ad “A”.
(i) Misurare la resistenza della lampadina “C” spenta a temperatura ambiente (assumere ); registrare il valore come .
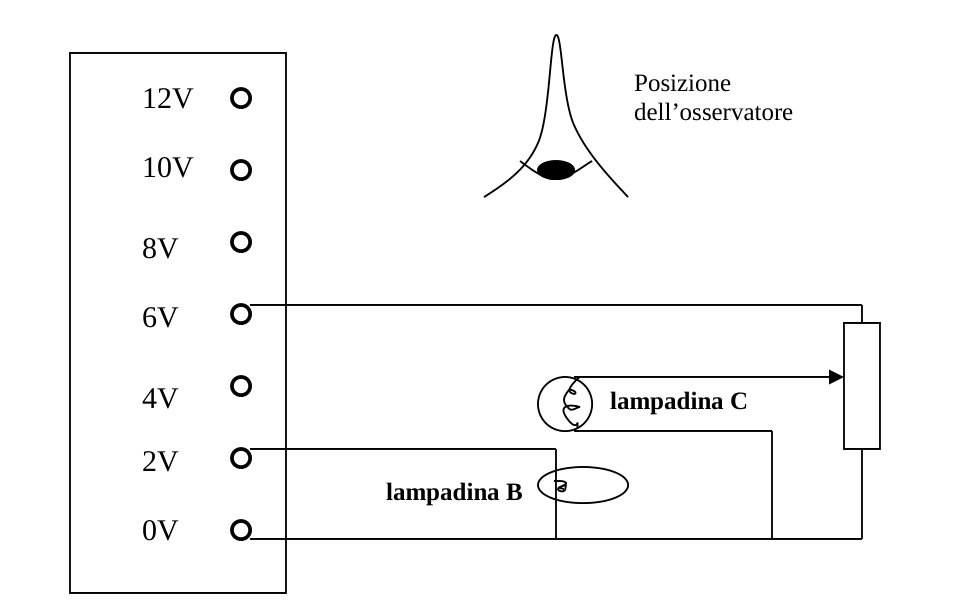
(ii) Usando il circuito di Figura 2, variare la corrente della lampadina “C” tramite il resistore variabile fino a quando, osservando i filamenti di “B” e “C” sovrapposti, si può dedurre che hanno la stessa temperatura. Misurare le resistenze delle lampadine “B” e “C” e registrare i valori come e .
(iii) Dal grafico del tungsteno, ricavare la temperatura comune dei filamenti di “B” e “C”; registrarla come .
(iv) Misurare la resistenza del filamento della lampadina “A” quando è alimentata a 12 V; registrare il valore come .
(v) Usando i valori , e , ricavare la temperatura del filamento della lampadina “A” quando è alimentata a 12 V; registrarla come .
Sono fornite le curve di Planck (intensità relativa di corpo nero) alle temperature: , , , , , .
Fase (e) — Curva di sensibilità corretta
Usare le curve di Planck e il risultato ottenuto al punto (d)(v) per tracciare un grafico corretto della conduttanza del fotoresistore (in unità arbitrarie) in funzione di .
Si assume che:
- la conduttanza del fotoresistore a ogni sia direttamente proporzionale all’intensità della radiazione a quella ;
- l’effetto di diffrazione del reticolo sia uniforme in tutto lo spettro di primo ordine.
Precauzioni
- Fare attenzione a non scottarsi toccando la lampadina accesa.
- La lampadina “B” non deve essere alimentata a una tensione superiore a .
- Il multimetro in funzione di ohmmetro non deve essere collegato a circuiti sotto tensione.
p.5 — Apparato sperimentale con lampadina, reticolo e LDR
p.5 — Dettaglio del reticolo con striscia di CDROM
p.5 — Dettaglio fotoresistore e multimetro
p.6 — Circuito alimentatore con lampadine B e C
Topic: Wave Optics, Thermodynamics, Circuits Metodi: Interference & Diffraction Analysis, Experimental Data Analysis, Graph Linearization Competenze: Experimental Data Analysis, Graph Linearization, Measurement & Instrumentation Objects: Diffraction Grating Fonte: Testo (PDF) — p.1
A CD ROM as a spectrometer
The purpose of this experiment is to plot a graph of the conductivity of a photoresistor (LDR: Light Dependent Resistance) as a function of the wavelength across the visible spectrum.
The conductivity is the reciprocal of the resistance: , measured in siemens ().
As a reflection lattice, a concave strip obtained from a CD ROM with (620 lines per millimeter) is used. The source is a tungsten filament lamp (12 V, 50 W, designated ‘A’).
The angle between the incident radius and the reflected radius in the first order spectrum is given by:
The experiment is divided into five stages:
Fase (a) — Osservazione qualitativa dello spettro
The apparatus is so arranged that the light from the lamp hits the reticle perpendicularly and the photoresistors are positioned in the first order, well-focused spectrum. Move the photoresistor along the first order spectrum and observe how its resistance , measured with the “X” multimeter, changes with position.
Fase (b) — Misura di
(i) Measure the resistance of the photoresistors at different positions along the first order spectrum and report the values in the table provided.
(ii) Building a chart of behaviour
in the light of the wavelength on millimeter paper.
Nota: il grafico ottenuto non riflette correttamente la sensibilità spettrale del fotoresistore perché non tiene conto delle caratteristiche di emissione della lampadina “A”. These will be studied in stages (c) and (d).
Fase (c) — Verifica del comportamento da corpo nero
If the 50 W lamp emits as a black body, it can be shown that the difference between the potential applied to the filament and the current passing through it is the ratio:
where is a constant.
(i) Measure the corresponding values pairs of and for the “A” lamp (the amp is already connected and must not be touched). Record the data and all the figures calculated in the table on the reply sheet.
(ii) Draw a suitable graph on millimeter paper to show that the filament behaves approximately like an ideal black body.
Fase (d) — Determinazione della temperatura del filamento
To correct the phase graph (b) the working temperature of the filament of the lamp ‘A’ when it is powered at 12 V is to be known. The resistivity graph of tungsten (in ) in relation to the temperature (in K) and a second auxiliary lamp ‘C’ (smaller, with measurable resistance at room temperature) and a lamp ‘B’ identical to ‘A’ are provided.
(i) Measure the resistance of the ‘C’ lamp when switched off at room temperature (assume ); record the value as .
(ii) Using the circuit in Figure 2, vary the current of the ‘C’ lamp through the variable resistor until, by observing the overlapping ‘B’ and ‘C’ filaments, it can be inferred that they have the same temperature. Measure the resistance of the ‘B’ and ‘C’ lamps and record values such as and .
(iii) From the graph of tungsten, obtain the common temperature of the filaments “B” and “C”; record it as .
(iv) Measure the strength of the filament of the lamp ‘A’ when it is powered at 12 V; record the value as .
(v) Using the values , and , obtain the temperature of the filament of the lamp ‘A’ when it is powered at 12 V; record it as .
Planck curves (relative black body intensity) are given at temperatures: , , , , , .
Fase (e) — Curva di sensibilità corretta
Use the Planck curves and the result obtained at point (d) (v) to draw a correct graph of the photoresistor conductance (in arbitrary units) as a function of .
It is assumed that:
- the conductivity of the photoresistor at each is directly proportional to the radiation intensity at ;
- the diffraction effect of the reticulum is uniform throughout the first order spectrum.
Precauzioni
- Be careful not to burn yourself by touching the light bulb.
- The ‘B’ lamp shall not be powered at a voltage greater than .
- The multimeter in the function of the ohmmeter shall not be connected to voltage circuits.
p.5 — Apparato sperimentale con lampadina, reticolo e LDR
p.5 — Dettaglio del reticolo con striscia di CDROM
**p.5 ** Detailed photoresistors and multimeters
**p.6 ** Power supply circuit with B and C lamps
Topic: Wave Optics, Thermodynamics, Circuits Metodi: Interference & Diffraction Analysis, Experimental Data Analysis, Graph Linearization Competenze: Experimental Data Analysis, Graph Linearization, Measurement & Instrumentation Objects: Diffraction Grating Fonte: Testo (PDF) — p.1