Celle solari E2
Page 1 of 9
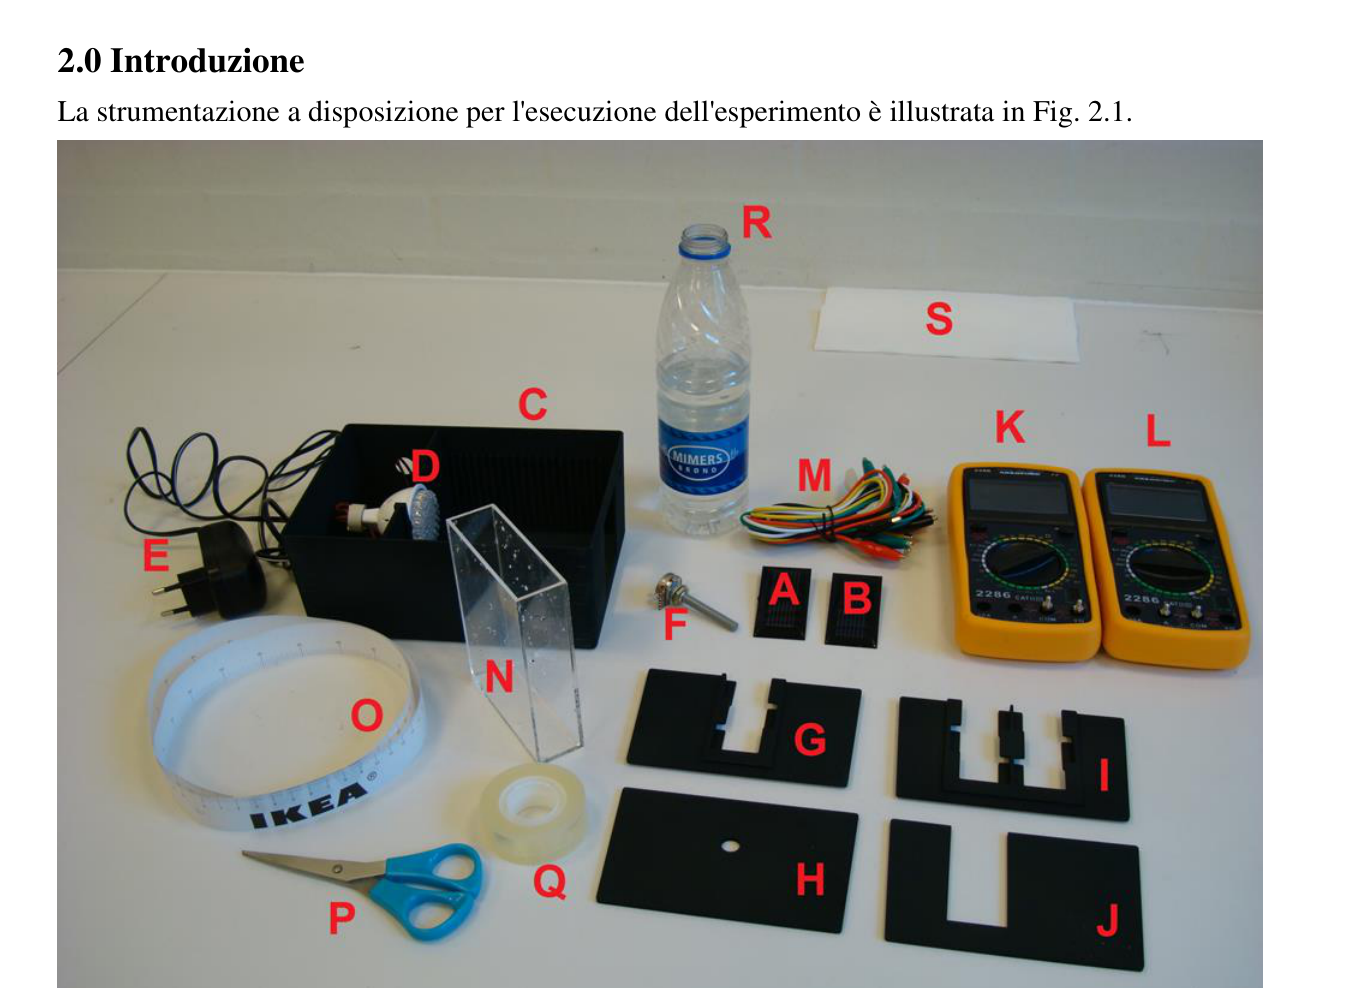
2.0 Introduzione La strumentazione a disposizione per l’esecuzione dell’esperimento è illustrata in Fig. 2.1.
Figura 2.1 Strumentazione usata per l’esperimento E2.
Lista della strumentazione (vedi Fig. 2.1): A: cella solare B: cella solare C: scatola con delle guide per montare la sorgente di luce, le celle solari e tutto il resto D: sorgente di luce a LED montata in un portalampada E: alimentatore per la sorgente di luce D F: resistore variabile G: sostegno per montare una cella solare singola nella scatola C H: apertura circolare da usare nella scatola C I: sostegno per montare due celle solari nella scatola C J: schermo piatto da usare nella scatola C
Celle solari E2
Page 2 of 9
K: multimetro digitale L: multimetro digitale M: fili elettrici con coccodrilli N: recipiente ottico (cuvette) O: metro di carta P: forbici Q: nastro adesivo R: acqua per riempire il recipiente ottico N S: fazzoletto di carta per asciugare l’acqua caduta T: recipiente di plastica per svuotare l’acqua dal recipiente ottico N (non si vede nella Fig. 2.1) U: pipetta di plastica (non si vede nella Fig. 2.1) V: coperchio della scatola C (non si vede nella Fig. 2.1)
Data sheet: tabella di costanti fondamentali
Velocità della luce nel vuoto
Carica elementare
Costante di Boltzmann
Una cella solare trasforma parte dell’energia elettromagnetica della luce incidente in energia elettrica separando le cariche elettriche nell’interno della cella solare stessa. In questo modo si può generare una corrente elettrica. L’esperimento E2 consente di studiare delle celle solari usando la strumentazione fornita. La strumentazione è formata da una scatola con dei sostegni per una sorgente luminosa e per alcune celle solari e da un coperchio. Il resistore variabile dovrà essere installato nella scatola, come si vede nella Fig. 2.2. Uno dei tre terminali del resitore variabile è stato eliminato perché non serve. Vengono forniti anche dei fili elettrici con coccodrilli e due celle solari con i terminali sul retro (contrassegnate da un numero di serie e dalle lettere A o B). Le due celle solari sono simili, potendo avere anche leggere differenze. I due multimetri hanno i terminali già predisposti per essere adoperarti uno come amperometro e l’altro come voltmetro (vedi la Fig. 2.3). Infine, nell’esperimento farai uso di un recipiente ottico da riempire con l’acqua di una bottiglia di plastica.
Celle solari E2
Page 3 of 9
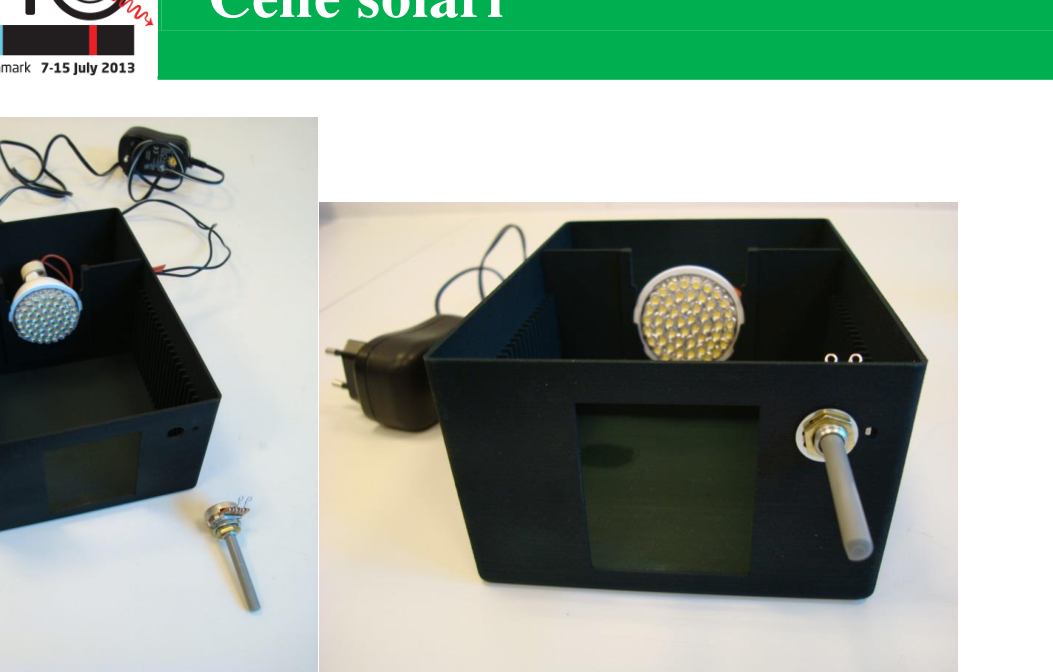
Figura 2.2 (a) Scatola con la sorgente luminosa e il resistore da montare. (b) Il resistore è stato montato nella scatola. Attento che il piccolo perno metallico sul resistore serve da ancoraggio e deve essere inserito nel piccolo forellino sulla parete della scatola, situato a destra di quello dove passa il resistore.
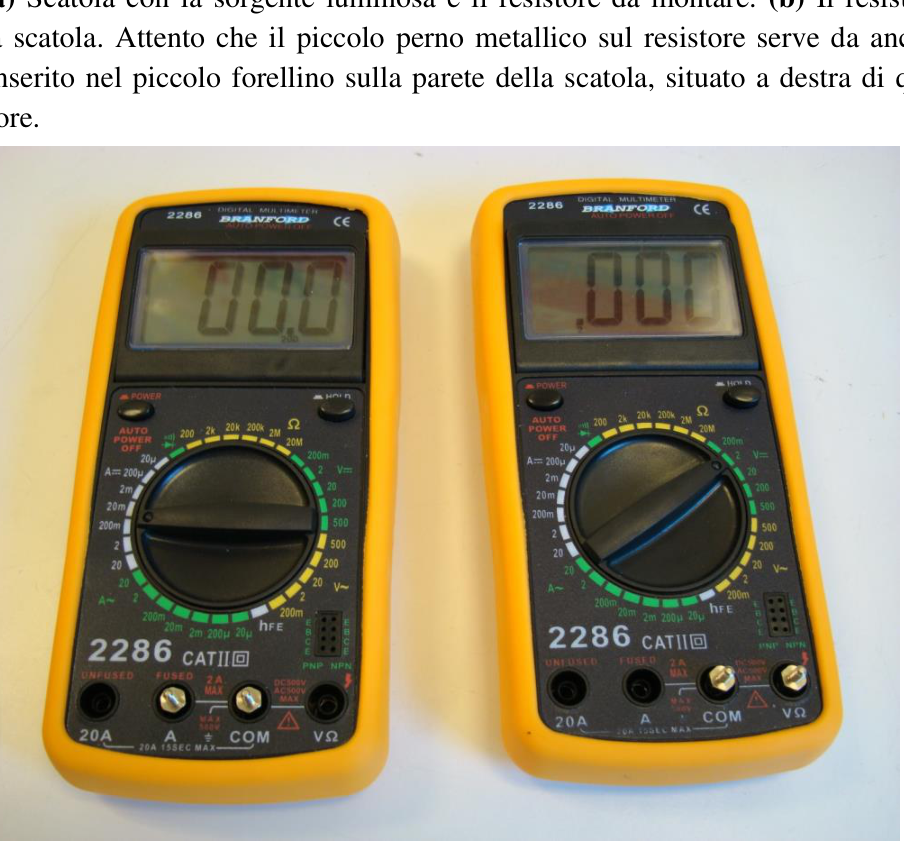
Figura 2.3 Multimetri con i terminali predisposti per usarli, rispettivamente, come amperometro (a sinistra) e come voltmetro (a destra). Si accende ciascuno dei due strumenti premendo il pulsante “POWER” nell’angolo in alto a sinistra. Gli strumenti si spengono automaticamente dopo un certo tempo in cui non funzionano. Si possono misurare sia la corrente che il voltaggio continui ( ) sia la corrente che il voltaggio alternati ( ). La resistenza interna del voltmetro è di 10 per qualunque
Celle solari E2
Page 4 of 9
fondo scala (range) di misurazione. La differenza di potenziale sull’amperometro è 200 mV al massimo della scala, qualunque sia il fondo scala (range) usato. In caso di overflow, il display mostra “l” e bisogna selezionare un range di misura più alto. Il pulsante “HOLD” (nell’angolo in altro a destra) non deve essere mai premuto, tranne quando vuoi mantenere una rilevazione.
ATTENZIONE: Non usare i multimetri come ohmetri sulla cella solare poiché la corrente di misurazione potrebbe danneggiare la cella. Quando si cambia il fondo scala dei multimetri, per favore gira la manopola con cautela: la lettura può essere instabile e la manopola potrebbe rompersi. Controlla sempre, perciò, che ci sia un numero sotto il punto decimale corrispondente al fondo scala quando effettui una misurazione – se il commutatore di scala non fosse completamente a posto, il multimetro non misurerebbe nulla anche se ci fossero delle cifre sul display.
Nota: non cambiare mai il voltaggio dell’alimentatore. Deve essere sempre mantenuto a 12 V per tutto l’esperimento. (L’alimentatore della sorgente luminosa deve essere connesso alla presa di rete (230 V ~) che c’è sul tuo banco di lavoro.) Nota: le considerazioni sulle incertezze di misura vanno fatte soltanto quando viene esplicitamente richiesto. Nota: tutte le grandezze misurate e calcolate vanno espresse con le unità del Sistema Internazionale. Nota: in ogni misurazione di corrente e di voltaggio la luce a LED deve essere accesa.
Celle solari E2
Page 5 of 9
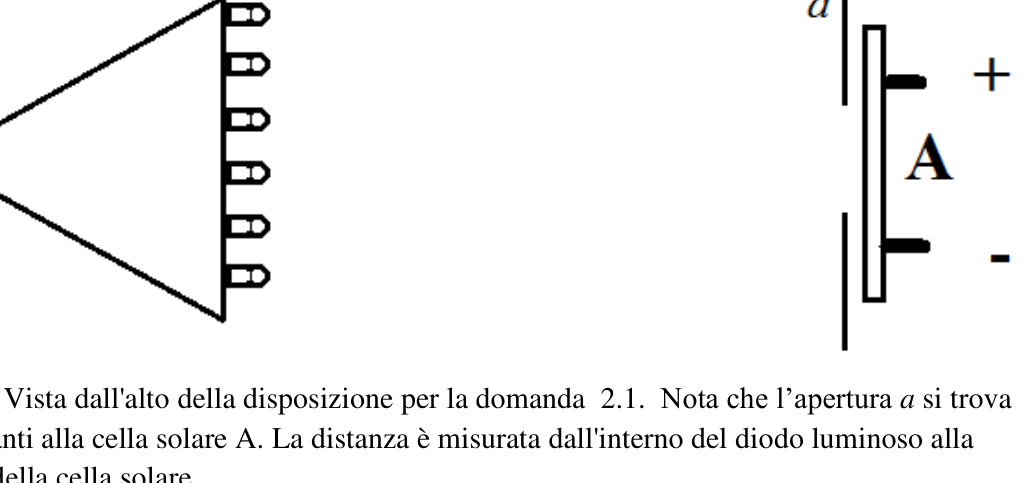
2.1 La dipendenza della corrente della cella solare dalla distanza dalla sorgente luminosa Per questa parte, dovrai misurare la corrente generata dalla cella solare collegata in un circuito elettrico con un amperometro e determinare come essa dipende dalla distanza tra la cella e la sorgente luminosa. La luce è prodotta dentro i singoli diodi luminosi e deve quindi essere misurato come mostrato in Fig. 2.4.
Figura 2.4 Vista dall’alto della disposizione per la domanda 2.1. Nota che l’apertura a si trova subito davanti alla cella solare A. La distanza è misurata dall’interno del diodo luminoso alla superficie della cella solare.
Non cambiare il fondo scala dell’amperometro durante questo esperimento: la resistenza interna dell’amperometro dipende dall’intervallo di misura e influenza la corrente che può essere ricavata dalla cella solare. Riporta il numero di serie della sorgente luminosa e della cella solare A sul foglio risposte. Posiziona la sorgente di luce nel sostegno ad U. La sorgente luminosa si adatta molto bene al suo sostegno per cui presta attenzione quando la monti. Posiziona la cella solare A nel sostegno per cella solare singola e poni lo schermo circolare nell’alloggiamento immediatamente di fronte alla cella solare stessa. La corrente come funzione della distanza dalla sorgente luminosa può, quando non è troppo piccolo, essere approssimata dall’espressione ( )
dove e sono costanti. 2.1a Misura I in funzione di r, e riporta in una tabella le tue misure. 1.0 2.1b Determina i valori di Ia e a utilizzando un opportuno metodo grafico. 1.0
Celle solari E2
Page 6 of 9
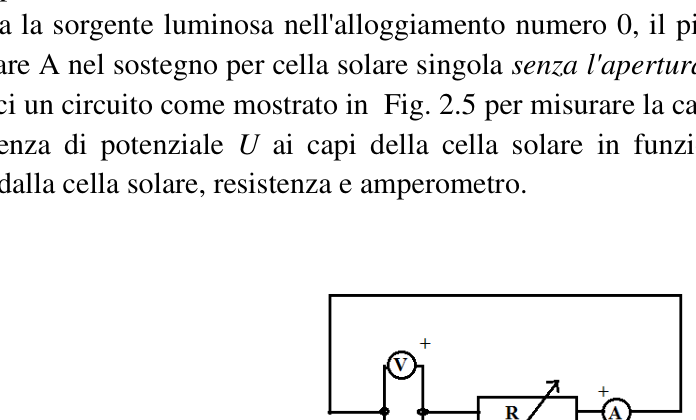
2.2 Caratteristica della cella solare Togli l’apertura circolare. Monta il resistore variabile nella scatola come mostrato in Fig. 2.2. Posiziona la sorgente luminosa nell’alloggiamento numero 0, il più lontano dal resistore. Monta la cella solare A nel sostegno per cella solare singola senza l’apertura circolare nell’alloggiamento 10. Costruisci un circuito come mostrato in Fig. 2.5 per misurare la caratteristica della cella solare, cioè la differenza di potenziale U ai capi della cella solare in funzione della corrente I nel circuito formato dalla cella solare, resistenza e amperometro.
Figura 2.5 Schema elettrico per misurare la caratteristica della domanda 2.2
2.2a Costruisci una tabella delle misure di U e I. 0.6 2.2b Con questi dati riporta in grafico la differenza di potenziale in funzione della corrente. 0.8 2.3 Caratteristica teorica della cella solare Per la cella solare in questo esperimento la corrente in funzione della differenza di potenziale è data dall’espressione ( ( ) ) dove i parametri , e sono costanti per una data illuminazione. Supponiamo che sia . Le costanti fondamentali e sono rispettivamente la carica elementare e la costante di Boltzmann. Si suppone che, in questo caso, il parametro abbia un valore compreso tra 1 e 4. Per alcuni valori della differenza di potenziale , la formula può essere approssimata come ( ) 2.3b Stima i possibili v
p.1 — Strumentazione usata per l’esperimento E2
p.3 — Scatola con sorgente e resistore da montare
p.3 — Multimetri digitali con terminali
p.5 — Vista dall’alto disposizione sorgente e cella
p.6 — Schema elettrico misura caratteristica cella
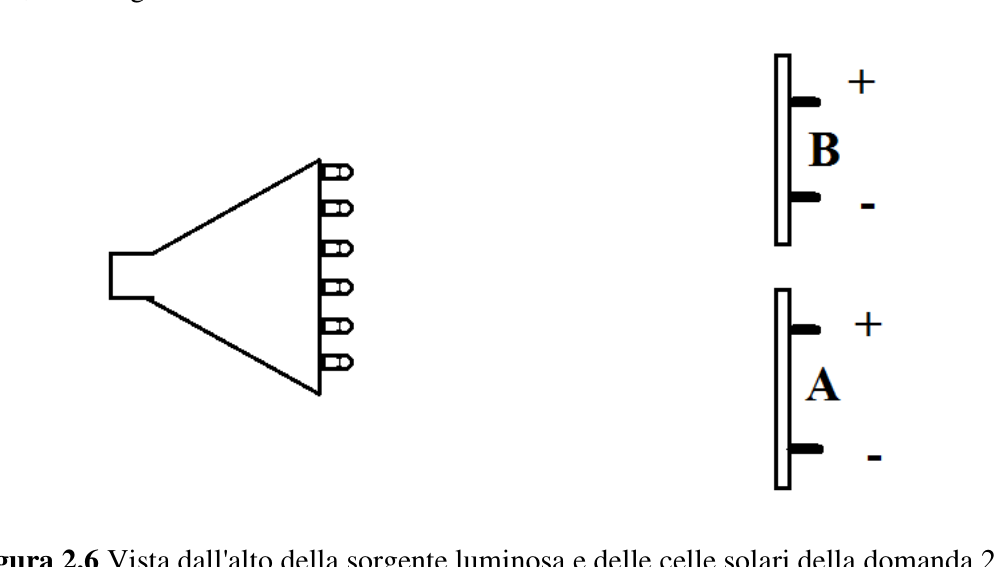
p.7 — Vista dall’alto sorgente e celle A B
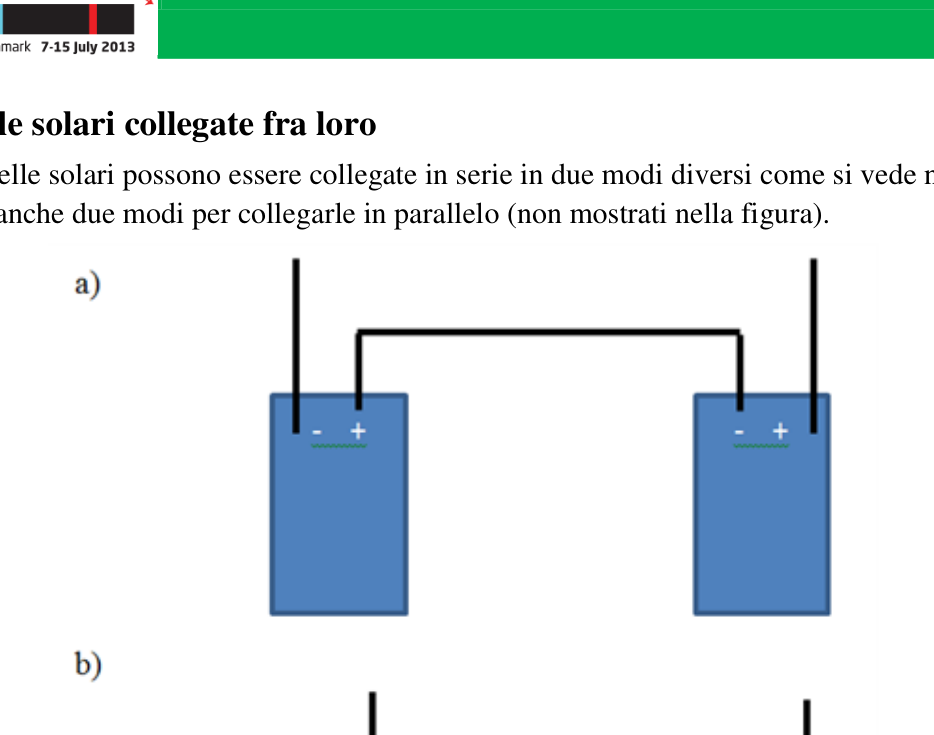
p.8 — Modi di collegare celle serie e parallelo
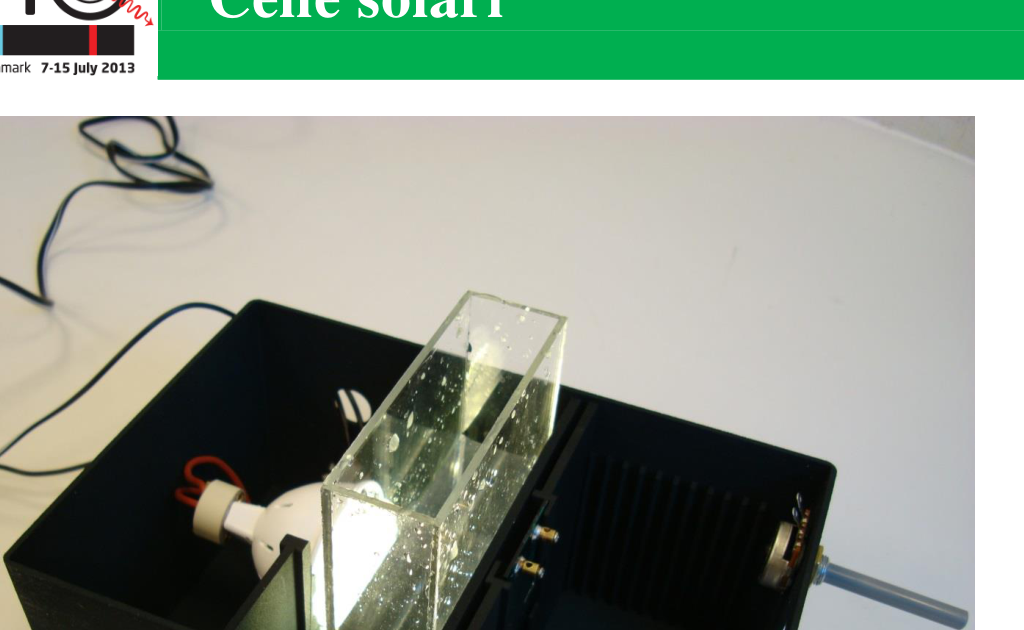
p.9 — Montaggio apparato sperimentale recipiente ottico
Topic: Circuits, Electrostatics, Geometric Optics Metodi: Experimental Data Analysis, Graph Linearization, Physical Modeling, Approximation & Series Expansion Competenze: Experimental Data Analysis, Graph Linearization, Mathematical Modeling Objects: Resistor, Wire Fonte: Testo (PDF) — p.1 Soluzione: Soluzioni (PDF)
The following table shows the data used for the calculation of the total energy consumption: E2
Page 1 of 9
2.0 Introduction to the The instrumentation available for the execution of the experiment is shown in Fig. 2.1.
Figure 2.1 Instrumentation used for the E2 experiment.
List of instruments (see Fig. 2.1): A: Solar cell The following is the list of the countries of the European Union: C: Box with guides for assembling the light source, solar cells and everything else D: LED light source mounted on a lamp holder E: power supply for light source D F: variable resistor G: support for mounting a single solar cell in box C H: circular opening to be used in box C I: Support for mounting two solar cells in box C J: Flat screen for use in box C
The following table shows the data used for the calculation of the total energy consumption: E2
Page 2 of 9
K: Digital multimeter L: Digital multimeter M: Electrical wires with crocodiles N: Optical container (s) O: paper meter P: Scissors The following is the list of the products used: A: water to fill the optical container N S: Paper handkerchief for drying water that has fallen T: Plastic container for draining water from optical container N (not shown in Fig. 2.1) U: plastic pipette (not shown in Fig. 2.1) V: Box cover C (not shown in Fig. 2.1)
Data sheet: table of fundamental constants
Speed of light in vacuum
Basic load
The Boltzmann constant is the constant
A solar cell converts some of the electromagnetic energy of the incident light into energy electrical by separating the electrical charges inside the solar cell itself. This way you can generate an electric current. The E2 experiment allows us to study solar cells using the the equipment provided. The instrumentation is made up of a box with supports for a The Commission has already adopted a proposal for a directive on the protection of the environment. The variable resistor shall be installed in the box, as shown in Fig. 2.2. One of the three variable receptor terminals is It’s been removed because it’s not necessary. Electrical wires with crocodiles and two cells are also supplied Solar panels with rear terminals (marked by a serial number and the letters A or B). The two Solar cells are similar, and they may have slight differences. The two multimeters have terminals. The first is the ampereometer and the second is the voltmeter (see Fig. 2.3). Finally, in the experiment, you’ll use an optical container to fill with a bottle of water. The plastic.
The following table shows the data used for the calculation of the total energy consumption: E2
Page 3 of 9
Figure 2.2 (a) Box with light source and resistor to be mounted. (b) The resistor has been It’s in the box. Please note that the small metal bolt on the resistor is used as anchorage and It must be inserted into the small furnace on the wall of the box, located to the right of the one where pass the resistor.
Figure 2.3 Multimeter with terminals designed to be used as ampereometers (a) left) and as voltmeter (right). You turn on each of the two instruments by pressing the button POWER in the upper left corner. The instruments will automatically turn off after a certain time when they don’t work. Both the current and the continuous voltage () and the current and voltage (the current and voltage) can be measured. current that the voltage alternates ( ). The internal resistance of the voltmeter is 10 for any
The following table shows the data used for the calculation of the total energy consumption: E2
Page 4 of 9
the bottom of the measuring scale (range). The difference in the potential on the amperometer is 200 mV per maximum of the scale, whatever the scale bottom (range) used. In the event of overflow, the display The sample size is the same as the sample size. The HOLD button (in the corner in It should never be pressed, except when you want to keep a recording.
Caution: Do not use multimeters as solar cell ohmets because the current of the measurement could damage the cell. When you change the bottom of the multimeter scale, for Please turn the handle carefully: the reading may be unstable and the handle may I’m going to break up. So always check that there’s a number under the decimal point. the bottom of the scale when you make a measurement if the scale switch was not The multimeter would not measure anything even if there were figures on the Display.
Note: never change the voltage of the power supply. It must always be kept at 12 V For the whole experiment. (The light source power supply must be connected to the network (230 V ~) that’s on your desk.) Note: Consideration of measurement uncertainties should only be made when explicitly requested. Note: all measured and calculated quantities must be expressed in units of the International System. Note: for each current and voltage measurement, the LED light shall be switched on.
The following table shows the data used for the calculation of the total energy consumption: E2
Page 5 of 9
2.1 The dependence of the solar cell current on the distance from the source Light On this side, you’ll have to measure the current generated by the solar cell connected to a circuit. The electrical system is a single-use cell with an ampere meter and determines how it depends on the distance between the cell and the The light source. Light is produced within the individual light diodes and therefore must be measured as shown in Figure 1. 2.4.
Figure 2.4 From the top of the question 2.1. Note that the opening is a Right in front of solar cell A. The distance is measured from the inside of the light diode to the the surface of the solar cell.
Don’t change the bottom scale of the amperometer during this experiment: internal resistance The current of the amperometer depends on the measurement range and affects the current that can be obtained from the solar cell. Report the serial number of the light source and the solar cell A on the reply sheet. Place the light source in the support of U. The light source fits very well with your support for which he pays attention when he mounts it. Position the A solar cell in the support for Single solar cell and place the circular screen in the housing immediately in front of the the solar cell itself. The current as a function of the distance from the light source can be, When it’s not too small, be approached by the expression ( )
where they’re constant. 2.1a Measure I in r, and report your measurements in a table. 1.0 2.1b Determine the values of Ia and a using an appropriate graphical method. 1.0
The following table shows the data used for the calculation of the total energy consumption: E2
Page 6 of 9
2.2 Characteristic of the solar cell Take the circular opening. Install the variable resistor in the box as shown in Fig. 2.2. Place the light source in room number 0, farther away from the resistor. Put it up . Solar cell A in the support for single solar cell without circular opening in housing 10. Build a circuit as shown in Fig. 2.5 to measure the characteristic of the solar cell, i.e. the difference in potential U to the heads of the solar cell in relation to current I in the circuit It’s made up of solar cells, resistance and amperometer.
Figure 2.5 Electrical scheme to measure the characteristic of the application 2.2
2.2a Build a table of U and I measures. 0.6 2.2b With these data, it shows the difference in potential in current. 0.8 2.3 Theoretical characteristics of the solar cell For the solar cell in this experiment the current as a function of the potential difference is given from the expression ( ( ) ) where the parameters are constant for a given illumination. Let’s say it’s . The fundamental constants are the elementary charge and the constant of the Boltzmann. What is it? The parameters are assumed to be between 1 and 4. For some values The formula can be approximated as ( ) 2.3b Estimate the possible v
**p.1 ** Instrumentation used for the E2 experiment
**p.3 ** Box with source and resistor to be mounted
The following table shows the results of the calculation of the total value of the sampled Union producers:
**p.5 ** View from the source and cell layout
The following table shows the results of the test:
**p.7 ** View from the upper source and cells A B
Ways to connect serial and parallel cells
The following information is provided by the manufacturer:
Topic: Circuits, Electrostatics, Geometric Optics Metodi: Experimental Data Analysis, Graph Linearization, Physical Modeling, Approximation & Series Expansion Competenze: Experimental Data Analysis, Graph Linearization, Mathematical Modeling Objects: Resistor, Wire Fonte: Testo (PDF) — p.1 Soluzione: Soluzioni (PDF)